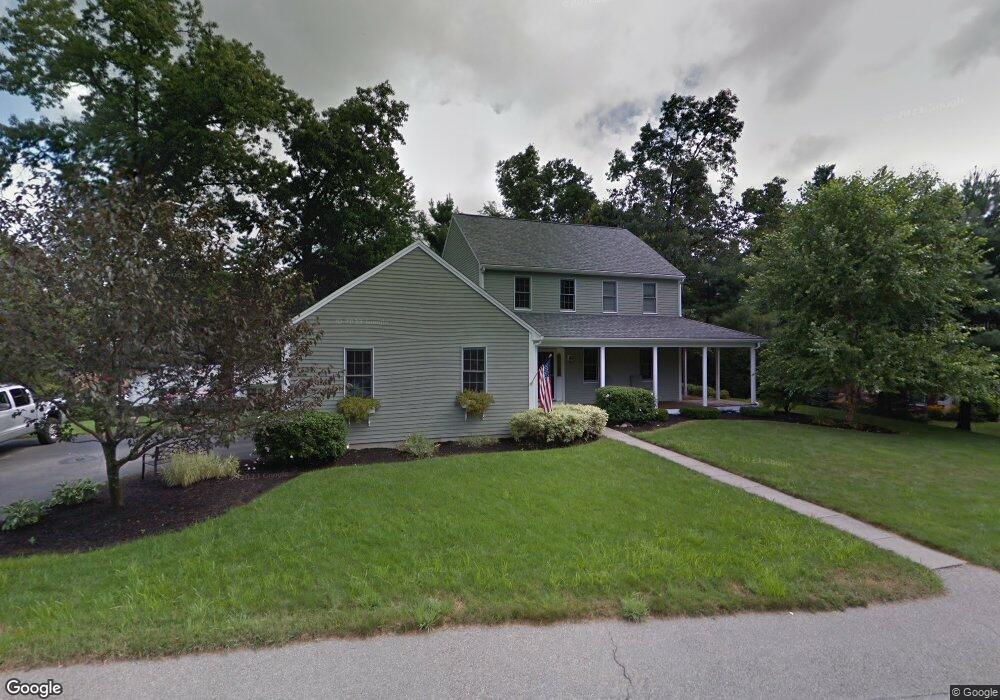
51 Old Cart Rd Auburn, MA 01501
Stoneville NeighborhoodEstimated Value: $648,000 - $749,000
4
Beds
3
Baths
2,402
Sq Ft
$288/Sq Ft
Est. Value
About This Home
This home is located at 51 Old Cart Rd, Auburn, MA 01501 and is currently estimated at $690,859, approximately $287 per square foot. 51 Old Cart Rd is a home located in Worcester County with nearby schools including Auburn Senior High School and Shrewsbury Montessori School - Auburn Campus.
Ownership History
Date
Name
Owned For
Owner Type
Purchase Details
Closed on
Jun 27, 2000
Sold by
Johnson Thomas M
Bought by
Leblanc Stephen J and Leblanc Francis C
Current Estimated Value
Home Financials for this Owner
Home Financials are based on the most recent Mortgage that was taken out on this home.
Original Mortgage
$120,000
Interest Rate
8.48%
Mortgage Type
Purchase Money Mortgage
Create a Home Valuation Report for This Property
The Home Valuation Report is an in-depth analysis detailing your home's value as well as a comparison with similar homes in the area
Home Values in the Area
Average Home Value in this Area
Purchase History
| Date | Buyer | Sale Price | Title Company |
|---|---|---|---|
| Leblanc Stephen J | $248,500 | -- |
Source: Public Records
Mortgage History
| Date | Status | Borrower | Loan Amount |
|---|---|---|---|
| Open | Leblanc Stephen J | $110,000 | |
| Closed | Leblanc Stephen J | $100,000 | |
| Closed | Leblanc Stephen J | $120,000 |
Source: Public Records
Tax History Compared to Growth
Tax History
| Year | Tax Paid | Tax Assessment Tax Assessment Total Assessment is a certain percentage of the fair market value that is determined by local assessors to be the total taxable value of land and additions on the property. | Land | Improvement |
|---|---|---|---|---|
| 2025 | $83 | $583,100 | $127,300 | $455,800 |
| 2024 | $8,531 | $571,400 | $121,700 | $449,700 |
| 2023 | $8,126 | $511,700 | $110,700 | $401,000 |
| 2022 | $7,429 | $441,700 | $110,700 | $331,000 |
| 2021 | $7,272 | $400,900 | $97,700 | $303,200 |
| 2020 | $7,208 | $400,900 | $97,700 | $303,200 |
| 2019 | $7,149 | $388,100 | $96,800 | $291,300 |
| 2018 | $6,991 | $379,100 | $90,500 | $288,600 |
| 2017 | $6,799 | $370,700 | $82,100 | $288,600 |
| 2016 | $6,509 | $359,800 | $85,500 | $274,300 |
| 2015 | $6,231 | $361,000 | $85,500 | $275,500 |
| 2014 | $6,093 | $352,400 | $81,300 | $271,100 |
Source: Public Records
Map
Nearby Homes