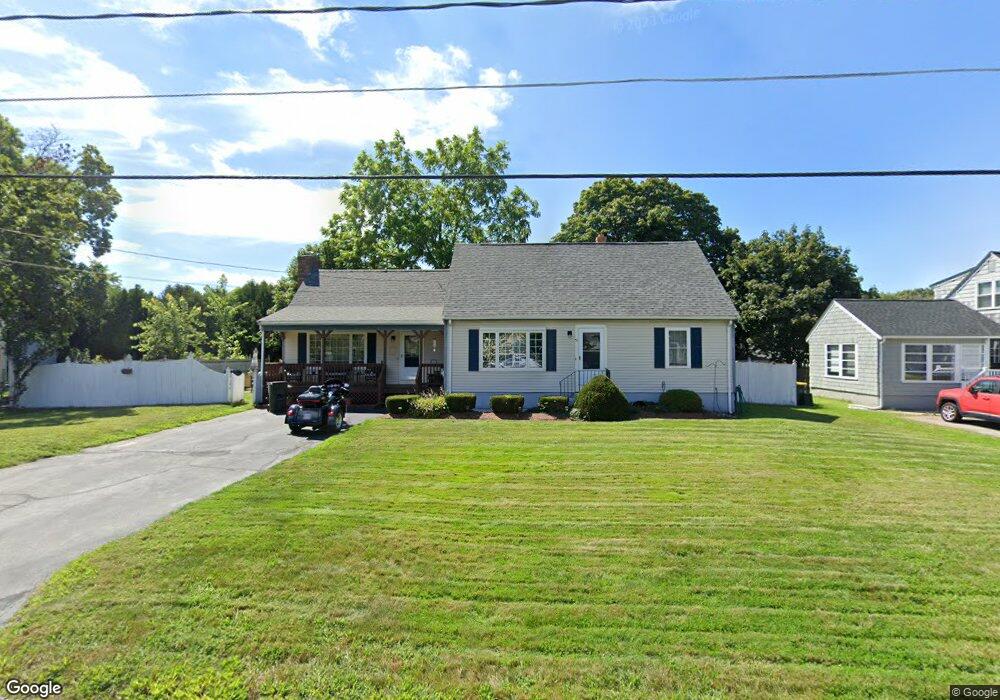
51 Oswego St Bellingham, MA 02019
Estimated Value: $535,000 - $594,000
3
Beds
2
Baths
2,027
Sq Ft
$276/Sq Ft
Est. Value
About This Home
This home is located at 51 Oswego St, Bellingham, MA 02019 and is currently estimated at $558,745, approximately $275 per square foot. 51 Oswego St is a home located in Norfolk County with nearby schools including Joseph F. DiPietro Elementary, Bellingham High School, and Rise Prep Mayoral Academy Middle School.
Ownership History
Date
Name
Owned For
Owner Type
Purchase Details
Closed on
Oct 6, 1995
Sold by
Rolls Julius L and Rolls Karen M
Bought by
Danielson James A and Danielson Jean M
Current Estimated Value
Create a Home Valuation Report for This Property
The Home Valuation Report is an in-depth analysis detailing your home's value as well as a comparison with similar homes in the area
Home Values in the Area
Average Home Value in this Area
Purchase History
| Date | Buyer | Sale Price | Title Company |
|---|---|---|---|
| Danielson James A | $141,000 | -- | |
| Danielson James A | $141,000 | -- |
Source: Public Records
Mortgage History
| Date | Status | Borrower | Loan Amount |
|---|---|---|---|
| Open | Danielson James A | $135,000 | |
| Closed | Danielson James A | $120,000 | |
| Closed | Danielson James A | $125,000 |
Source: Public Records
Tax History
| Year | Tax Paid | Tax Assessment Tax Assessment Total Assessment is a certain percentage of the fair market value that is determined by local assessors to be the total taxable value of land and additions on the property. | Land | Improvement |
|---|---|---|---|---|
| 2025 | $5,676 | $451,900 | $165,200 | $286,700 |
| 2024 | $5,449 | $423,700 | $150,800 | $272,900 |
| 2023 | $5,253 | $402,500 | $143,700 | $258,800 |
| 2022 | $5,148 | $365,600 | $119,800 | $245,800 |
| 2021 | $4,982 | $345,700 | $119,800 | $225,900 |
| 2020 | $4,890 | $343,900 | $119,800 | $224,100 |
| 2019 | $4,787 | $336,900 | $119,800 | $217,100 |
| 2018 | $4,512 | $313,100 | $115,200 | $197,900 |
| 2017 | $4,374 | $305,000 | $115,200 | $189,800 |
| 2016 | $4,140 | $289,700 | $113,200 | $176,500 |
| 2015 | $3,970 | $278,600 | $108,900 | $169,700 |
| 2014 | $3,971 | $270,900 | $106,400 | $164,500 |
Source: Public Records
Map
Nearby Homes
- 70 Oswego St
- 90 Pleasant St
- 60 Freeman St
- 21 Irving St
- 101 Pine Grove Ave
- 82 Paine St
- Lot 2 Pulaski Blvd
- 22 Fox Run Rd
- 194 Paine St
- 13 Ethel St
- 40 Valley St
- Lot 3 Pickering Rd
- Lot 2 Pickering Rd
- Lot 1 Pickering Rd
- Lot 4 Pickering Rd
- Lot 5 Pickering Rd
- 178 Saint Louis Ave
- 188 Saint Louis Ave
- 202 Paine St
- 212 Saint Louis Ave
Your Personal Tour Guide
Ask me questions while you tour the home.