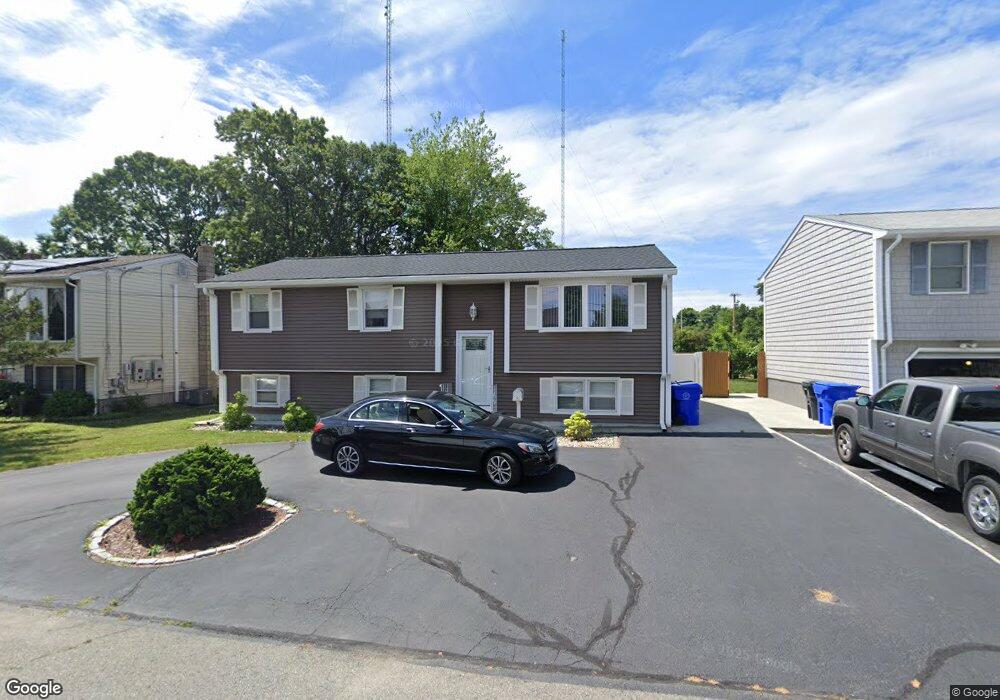
51 Pershing St East Providence, RI 02914
Estimated Value: $388,000 - $445,000
3
Beds
2
Baths
1,138
Sq Ft
$374/Sq Ft
Est. Value
About This Home
This home is located at 51 Pershing St, East Providence, RI 02914 and is currently estimated at $425,531, approximately $373 per square foot. 51 Pershing St is a home located in Providence County with nearby schools including East Providence High School, Ocean State Montessori School, and Lincoln School.
Ownership History
Date
Name
Owned For
Owner Type
Purchase Details
Closed on
Jun 5, 2023
Sold by
Neves Arthur G
Bought by
Neves Valerie L
Current Estimated Value
Purchase Details
Closed on
May 21, 2013
Sold by
Neves Arthur G and Neves Nellie A
Bought by
Neves Arthur G
Create a Home Valuation Report for This Property
The Home Valuation Report is an in-depth analysis detailing your home's value as well as a comparison with similar homes in the area
Home Values in the Area
Average Home Value in this Area
Purchase History
| Date | Buyer | Sale Price | Title Company |
|---|---|---|---|
| Neves Valerie L | -- | None Available | |
| Neves Valerie L | -- | None Available | |
| Neves Arthur G | -- | -- | |
| Neves Arthur G | -- | -- |
Source: Public Records
Mortgage History
| Date | Status | Borrower | Loan Amount |
|---|---|---|---|
| Previous Owner | Neves Arthur G | $189,405 | |
| Previous Owner | Neves Arthur G | $189,268 | |
| Previous Owner | Neves Arthur G | $25,000 | |
| Previous Owner | Neves Arthur | $75,000 |
Source: Public Records
Tax History Compared to Growth
Tax History
| Year | Tax Paid | Tax Assessment Tax Assessment Total Assessment is a certain percentage of the fair market value that is determined by local assessors to be the total taxable value of land and additions on the property. | Land | Improvement |
|---|---|---|---|---|
| 2024 | $5,321 | $347,100 | $100,100 | $247,000 |
| 2023 | $5,123 | $347,100 | $100,100 | $247,000 |
| 2022 | $4,689 | $214,500 | $44,700 | $169,800 |
| 2021 | $4,612 | $214,500 | $44,700 | $169,800 |
| 2020 | $4,417 | $214,500 | $44,700 | $169,800 |
| 2019 | $4,294 | $214,500 | $44,700 | $169,800 |
| 2018 | $4,089 | $178,700 | $45,300 | $133,400 |
| 2017 | $3,998 | $178,700 | $45,300 | $133,400 |
| 2016 | $3,978 | $178,700 | $45,300 | $133,400 |
| 2015 | $3,890 | $169,500 | $41,900 | $127,600 |
| 2014 | $3,890 | $169,500 | $41,900 | $127,600 |
Source: Public Records
Map
Nearby Homes
- 169 Wilmarth Ave
- 200 Woodward Ave
- 115 Sutton Ave
- 661 N Broadway
- 73 Massasoit Ave
- 674 N Broadway
- 48 Hobson Ave
- 58 Central Ave
- 41 What Cheer Ave
- 168 Waterman Ave
- 91 Ivy St
- 12 Parsons St Unit 14
- 43 Mary Ave Unit 45
- 71 Priscilla Ave
- 19 Rhode Island Ave
- 229 Medway St Unit 103
- 62 Byron Ave
- 58 Summit St
- 228 Medway St
- 74 E Point Dr Unit 23