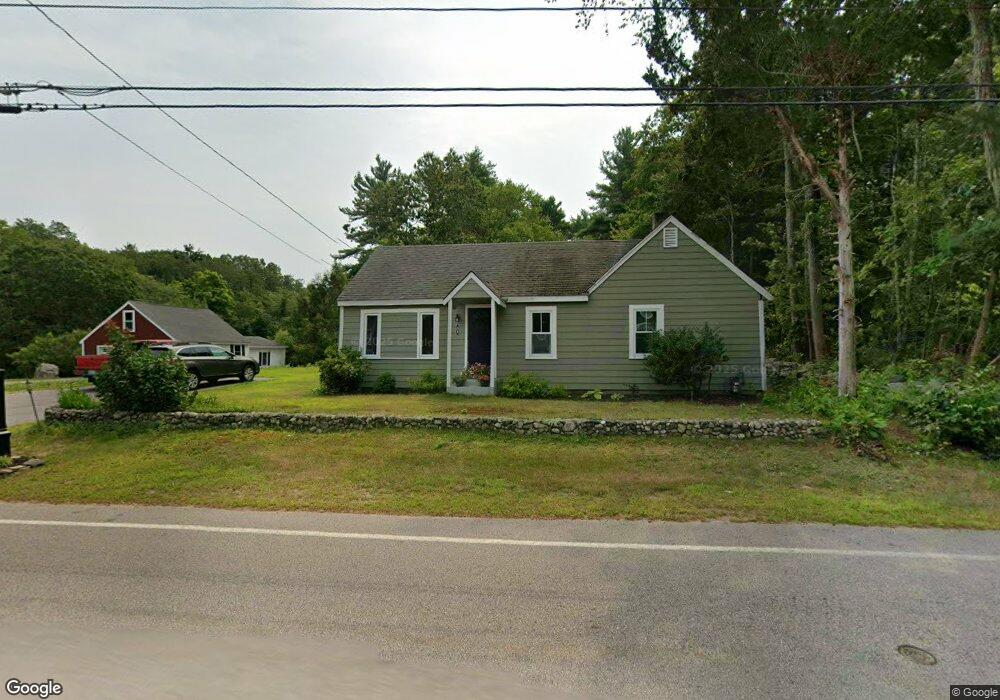
51 Plain St Norton, MA 02766
Estimated Value: $495,855 - $618,000
2
Beds
1
Bath
1,454
Sq Ft
$386/Sq Ft
Est. Value
About This Home
This home is located at 51 Plain St, Norton, MA 02766 and is currently estimated at $560,714, approximately $385 per square foot. 51 Plain St is a home located in Bristol County with nearby schools including J.C. Solmonese Elementary School, Henri A. Yelle Elementary School, and Norton Middle School.
Ownership History
Date
Name
Owned For
Owner Type
Purchase Details
Closed on
Sep 19, 2007
Sold by
Varney Carlene E
Bought by
Varney Carlene E and Oneal William
Current Estimated Value
Home Financials for this Owner
Home Financials are based on the most recent Mortgage that was taken out on this home.
Original Mortgage
$225,000
Outstanding Balance
$142,892
Interest Rate
6.63%
Mortgage Type
Purchase Money Mortgage
Estimated Equity
$417,822
Purchase Details
Closed on
Dec 21, 1999
Sold by
Varney Carlene E and Costa John J
Bought by
Varney Carlene E
Home Financials for this Owner
Home Financials are based on the most recent Mortgage that was taken out on this home.
Original Mortgage
$97,500
Interest Rate
7.81%
Mortgage Type
Purchase Money Mortgage
Purchase Details
Closed on
Jun 19, 1991
Sold by
Varney Carl E and Varney Mildred
Bought by
Varney Carleene E and Costa John J
Create a Home Valuation Report for This Property
The Home Valuation Report is an in-depth analysis detailing your home's value as well as a comparison with similar homes in the area
Home Values in the Area
Average Home Value in this Area
Purchase History
| Date | Buyer | Sale Price | Title Company |
|---|---|---|---|
| Varney Carlene E | -- | -- | |
| Varney Carlene E | $5,000 | -- | |
| Varney Carleene E | $35,700 | -- |
Source: Public Records
Mortgage History
| Date | Status | Borrower | Loan Amount |
|---|---|---|---|
| Open | Varney Carlene E | $225,000 | |
| Previous Owner | Varney Carleene E | $117,500 | |
| Previous Owner | Varney Carleene E | $107,300 | |
| Previous Owner | Varney Carleene E | $97,500 |
Source: Public Records
Tax History
| Year | Tax Paid | Tax Assessment Tax Assessment Total Assessment is a certain percentage of the fair market value that is determined by local assessors to be the total taxable value of land and additions on the property. | Land | Improvement |
|---|---|---|---|---|
| 2025 | $53 | $406,000 | $185,000 | $221,000 |
| 2024 | $5,012 | $387,000 | $176,100 | $210,900 |
| 2023 | $4,747 | $365,400 | $166,100 | $199,300 |
| 2022 | $4,615 | $323,600 | $151,000 | $172,600 |
| 2021 | $4,289 | $287,300 | $143,800 | $143,500 |
| 2020 | $4,132 | $279,200 | $139,600 | $139,600 |
| 2019 | $3,971 | $266,500 | $134,300 | $132,200 |
| 2018 | $3,852 | $254,100 | $134,300 | $119,800 |
| 2017 | $3,801 | $247,300 | $134,300 | $113,000 |
| 2016 | $3,565 | $228,400 | $134,300 | $94,100 |
| 2015 | $3,440 | $223,500 | $131,700 | $91,800 |
| 2014 | $3,278 | $213,300 | $125,400 | $87,900 |
Source: Public Records
Map
Nearby Homes
- 90 Pine St
- 29 Germain Way Unit 3
- 0 S Washington St Unit 73437419
- 17 Lloyd Cir Unit 36
- 24 Lloyd Cir Unit 34
- 152 Pine St Unit 23
- 4 Stanley Rd
- 11 Lloyd Cir Unit 39
- 20 Lloyd Cir Unit 32
- 14 Lloyd Cir Unit 29
- 195 E Main St
- Lot 3B Hill St
- O Leonard St
- 103 King Philip Rd
- 83 W Main St
- 9 Winnecunnet Dr Unit 9
- 93 Mansfield Ave
- 1 Wilbur Terrace Unit 6
- 0 Cobb St
- 35 Owen Rd
Your Personal Tour Guide
Ask me questions while you tour the home.