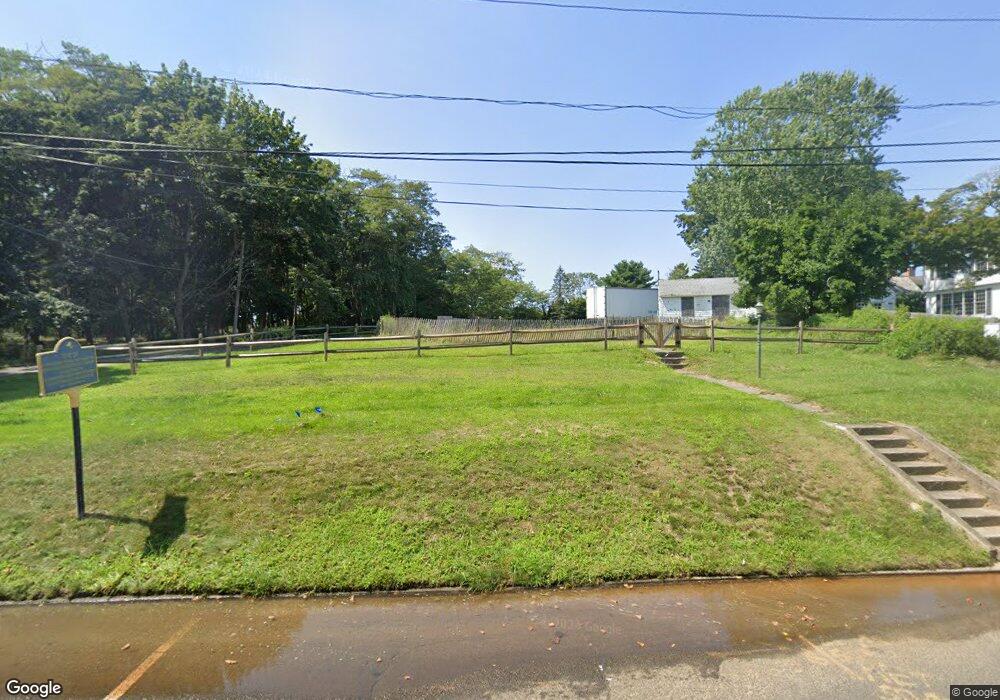
51 Pond Ln Southampton, NY 11968
Estimated Value: $3,291,000 - $8,420,124
1
Bed
4
Baths
492
Sq Ft
$11,902/Sq Ft
Est. Value
About This Home
This home is located at 51 Pond Ln, Southampton, NY 11968 and is currently estimated at $5,855,562, approximately $11,901 per square foot. 51 Pond Ln is a home located in Suffolk County with nearby schools including Southampton Elementary School, Southampton Intermediate School, and Southampton High School.
Ownership History
Date
Name
Owned For
Owner Type
Purchase Details
Closed on
Aug 12, 2015
Sold by
Reecam Holdings Llc
Bought by
Town Of Southampton
Current Estimated Value
Purchase Details
Closed on
Jul 15, 2013
Sold by
Chiarani Paul
Bought by
Reecam Holdings Llc
Home Financials for this Owner
Home Financials are based on the most recent Mortgage that was taken out on this home.
Original Mortgage
$2,200,000
Interest Rate
4.17%
Mortgage Type
Purchase Money Mortgage
Create a Home Valuation Report for This Property
The Home Valuation Report is an in-depth analysis detailing your home's value as well as a comparison with similar homes in the area
Home Values in the Area
Average Home Value in this Area
Purchase History
| Date | Buyer | Sale Price | Title Company |
|---|---|---|---|
| Town Of Southampton | $4,300,000 | None Available | |
| Reecam Holdings Llc | -- | -- |
Source: Public Records
Mortgage History
| Date | Status | Borrower | Loan Amount |
|---|---|---|---|
| Previous Owner | Reecam Holdings Llc | $2,200,000 |
Source: Public Records
Tax History Compared to Growth
Tax History
| Year | Tax Paid | Tax Assessment Tax Assessment Total Assessment is a certain percentage of the fair market value that is determined by local assessors to be the total taxable value of land and additions on the property. | Land | Improvement |
|---|---|---|---|---|
| 2024 | -- | $9,140,700 | $9,064,000 | $76,700 |
| 2023 | -- | $9,140,700 | $9,064,000 | $76,700 |
| 2022 | $8,919 | $9,140,700 | $9,064,000 | $76,700 |
| 2021 | $8,919 | $9,140,700 | $9,064,000 | $76,700 |
| 2020 | $1,858 | $9,140,700 | $9,064,000 | $76,700 |
| 2019 | $8,919 | $0 | $0 | $0 |
| 2018 | -- | $4,291,200 | $4,229,900 | $61,300 |
| 2017 | -- | $3,989,000 | $3,927,700 | $61,300 |
| 2016 | $1,858 | $3,989,000 | $3,927,700 | $61,300 |
| 2015 | -- | $2,723,400 | $2,266,000 | $457,400 |
| 2014 | -- | $2,723,400 | $2,266,000 | $457,400 |
Source: Public Records
Map
Nearby Homes