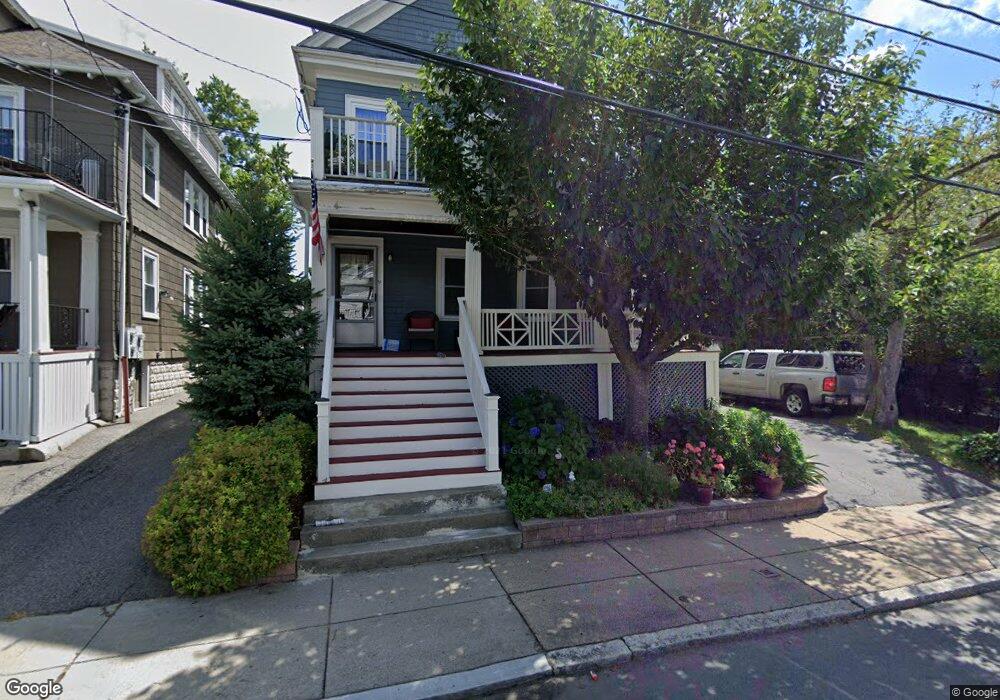
51 Presentation Rd Brighton, MA 02135
Brighton NeighborhoodEstimated Value: $1,068,000 - $1,236,000
4
Beds
4
Baths
2,908
Sq Ft
$405/Sq Ft
Est. Value
About This Home
This home is located at 51 Presentation Rd, Brighton, MA 02135 and is currently estimated at $1,177,434, approximately $404 per square foot. 51 Presentation Rd is a home located in Suffolk County with nearby schools including St Columbkille Partnership School and Mesivta High School of Greater Boston.
Ownership History
Date
Name
Owned For
Owner Type
Purchase Details
Closed on
Jun 16, 1988
Sold by
Lardiere Michael
Bought by
Kedesdy Jurgen H
Current Estimated Value
Home Financials for this Owner
Home Financials are based on the most recent Mortgage that was taken out on this home.
Original Mortgage
$268,000
Interest Rate
10.24%
Mortgage Type
Purchase Money Mortgage
Create a Home Valuation Report for This Property
The Home Valuation Report is an in-depth analysis detailing your home's value as well as a comparison with similar homes in the area
Home Values in the Area
Average Home Value in this Area
Purchase History
| Date | Buyer | Sale Price | Title Company |
|---|---|---|---|
| Kedesdy Jurgen H | $298,000 | -- |
Source: Public Records
Mortgage History
| Date | Status | Borrower | Loan Amount |
|---|---|---|---|
| Open | Kedesdy Jurgen H | $309,200 | |
| Closed | Kedesdy Jurgen H | $268,000 |
Source: Public Records
Tax History
| Year | Tax Paid | Tax Assessment Tax Assessment Total Assessment is a certain percentage of the fair market value that is determined by local assessors to be the total taxable value of land and additions on the property. | Land | Improvement |
|---|---|---|---|---|
| 2025 | $11,486 | $991,900 | $297,100 | $694,800 |
| 2024 | $11,656 | $1,069,400 | $328,100 | $741,300 |
| 2023 | $10,635 | $990,200 | $303,800 | $686,400 |
| 2022 | $10,260 | $943,000 | $289,300 | $653,700 |
| 2021 | $10,062 | $943,000 | $289,300 | $653,700 |
| 2020 | $9,656 | $914,400 | $241,500 | $672,900 |
| 2019 | $9,361 | $888,100 | $196,700 | $691,400 |
| 2018 | $8,695 | $829,700 | $196,700 | $633,000 |
| 2017 | $8,614 | $813,400 | $196,700 | $616,700 |
| 2016 | $8,135 | $739,500 | $196,700 | $542,800 |
| 2015 | $7,106 | $586,800 | $183,100 | $403,700 |
| 2014 | $6,392 | $508,100 | $183,100 | $325,000 |
Source: Public Records
Map
Nearby Homes
- 144 Newton St Unit 1
- 99 Tremont St Unit 206
- 99 Tremont St Unit 105
- 99 Tremont St Unit 513
- 143 Tremont St Unit A
- 143 Tremont St Unit 2
- 12 Bigelow Cir Unit 2
- 12 Bigelow Cir Unit 3
- 70 Washington St
- 70 Washington St Unit 70
- 48 Hardwick Terrace
- 21 Upcrest Rd
- 18 Breck Ave Unit 18
- 96 Brayton Rd
- 26-28 Newton St
- 571-575 Washington St
- 19 Crescent Circuit Crescent S
- 29-31 Hobson St
- 27 S Crescent Circuit Crescent
- 9 Oliva Rd
- 51 Presentation Rd Unit 1
- 55 Presentation Rd
- 55 Presentation Rd Unit 1
- 57 Presentation Rd
- 57 Presentation Rd Unit 7
- 57 Presentation Rd
- 43 Presentation Rd
- 52 Presentation Rd
- 52 Presentation Rd Unit 4
- 59 Presentation Rd
- 48 Presentation Rd Unit 2
- 48 Presentation Rd Unit 1
- 48 Presentation Rd
- 56 Presentation Rd
- 56 Presentation Rd Unit 1
- 39 Presentation Rd
- 42 Matchett St
- 38 Matchett St
- 46 Matchett St
- 44 Presentation Rd
Your Personal Tour Guide
Ask me questions while you tour the home.