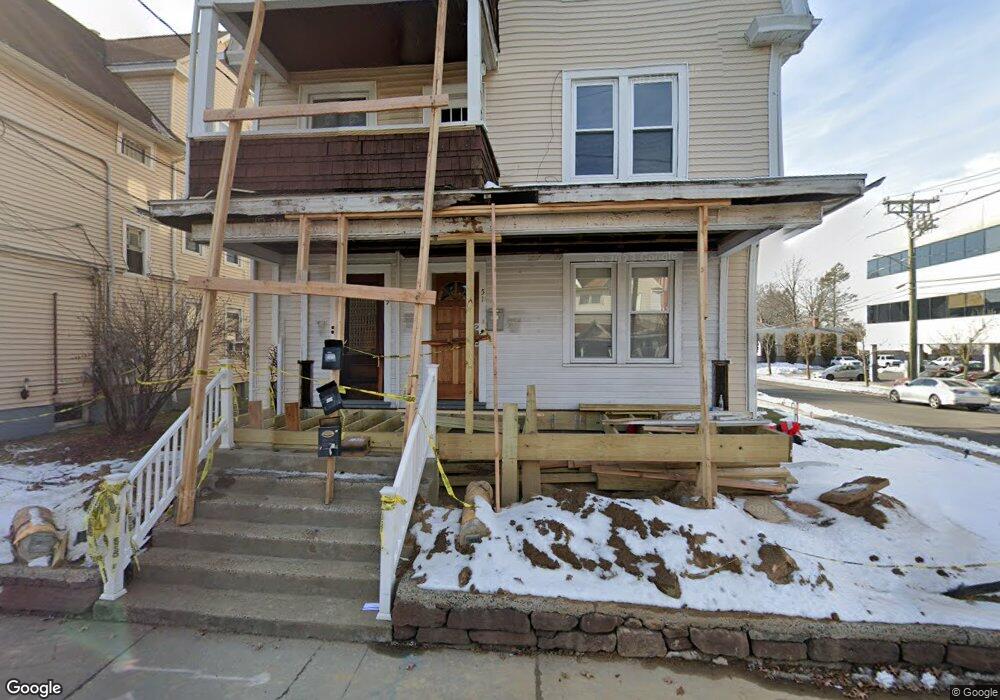
51 Prospect Ave Hartford, CT 06106
Estimated Value: $441,000 - $737,000
7
Beds
3
Baths
3,716
Sq Ft
$157/Sq Ft
Est. Value
About This Home
This home is located at 51 Prospect Ave, Hartford, CT 06106 and is currently estimated at $582,333, approximately $156 per square foot. 51 Prospect Ave is a home located in Hartford County with nearby schools including Charter Oak International Academy, Sedgwick Middle School, and Conard High School.
Ownership History
Date
Name
Owned For
Owner Type
Purchase Details
Closed on
Aug 12, 2021
Sold by
Verrengia Joseph F
Bought by
Rodriguez Olga R and Nieves Angel M
Current Estimated Value
Home Financials for this Owner
Home Financials are based on the most recent Mortgage that was taken out on this home.
Original Mortgage
$403,895
Outstanding Balance
$367,266
Interest Rate
2.9%
Mortgage Type
FHA
Estimated Equity
$215,067
Purchase Details
Closed on
Nov 13, 2012
Sold by
Correia Henrique
Bought by
Verrengia Joseph F
Purchase Details
Closed on
Jan 28, 2008
Sold by
American Eagle Fcu
Bought by
Verrengia Joseph F
Home Financials for this Owner
Home Financials are based on the most recent Mortgage that was taken out on this home.
Original Mortgage
$200,000
Interest Rate
15%
Purchase Details
Closed on
May 26, 1999
Sold by
Coalitn W Htfd Intrfth
Bought by
Brooks Emmanuel
Home Financials for this Owner
Home Financials are based on the most recent Mortgage that was taken out on this home.
Original Mortgage
$108,100
Interest Rate
6.82%
Create a Home Valuation Report for This Property
The Home Valuation Report is an in-depth analysis detailing your home's value as well as a comparison with similar homes in the area
Home Values in the Area
Average Home Value in this Area
Purchase History
| Date | Buyer | Sale Price | Title Company |
|---|---|---|---|
| Rodriguez Olga R | $393,000 | None Available | |
| Verrengia Joseph F | $20,000 | -- | |
| Verrengia Joseph F | $207,000 | -- | |
| Brooks Emmanuel | $109,000 | -- |
Source: Public Records
Mortgage History
| Date | Status | Borrower | Loan Amount |
|---|---|---|---|
| Open | Rodriguez Olga R | $403,895 | |
| Previous Owner | Brooks Emmanuel | $205,000 | |
| Previous Owner | Brooks Emmanuel | $200,000 | |
| Previous Owner | Brooks Emmanuel | $108,100 |
Source: Public Records
Tax History Compared to Growth
Tax History
| Year | Tax Paid | Tax Assessment Tax Assessment Total Assessment is a certain percentage of the fair market value that is determined by local assessors to be the total taxable value of land and additions on the property. | Land | Improvement |
|---|---|---|---|---|
| 2025 | $12,278 | $274,190 | $35,000 | $239,190 |
| 2024 | $11,612 | $274,190 | $35,000 | $239,190 |
| 2023 | $10,369 | $253,400 | $35,000 | $218,400 |
| 2022 | $10,308 | $253,400 | $35,000 | $218,400 |
| 2021 | $9,802 | $231,070 | $25,300 | $205,770 |
| 2020 | $9,659 | $231,070 | $23,600 | $207,470 |
| 2019 | $9,659 | $231,070 | $23,590 | $207,480 |
| 2018 | $9,474 | $231,070 | $23,590 | $207,480 |
| 2017 | $9,483 | $231,070 | $23,590 | $207,480 |
| 2016 | $8,419 | $213,080 | $37,450 | $175,630 |
| 2015 | $8,163 | $213,080 | $37,450 | $175,630 |
| 2014 | $7,963 | $213,080 | $37,450 | $175,630 |
Source: Public Records
Map
Nearby Homes
- 311 New Park Ave
- 24 Merrill St Unit C5
- 24 Merrill St Unit B5
- 100 Kane St Unit C5
- 26 Saint Augustine St
- 90 Kane St Unit D10
- 136 Kane St Unit B10
- 21 Saint James St
- 101 Englewood Ave
- 106 Englewood Ave
- 103 Edgemere Ave
- 101 Madison Ave
- 114 Edgemere Ave
- 102 Oakwood Ave Unit B5
- 198, 196, 194, 190, Bonner St
- 170 Bonner St
- 287 Whiting Ln
- 21 Warren Terrace
- 25 Warren Terrace
- 120 Nilan St
- 45 Prospect Ave
- 11 Boulanger Ave
- 69 Prospect Ave
- 67 Prospect St
- 17 Boulanger Ave
- 16 Levesque Ave
- 67 Prospect Ave
- 20 Levesque Ave
- 37 Prospect Ave
- 21 Boulanger Ave
- 24 Levesque Ave
- 18 Levesque Ave Unit 2
- 18 Levesque Ave
- 18 Levesque Ave Unit 1
- 62 Prospect Ave
- 42 Prospect Ave
- 68 Prospect Ave
- 22 Boulanger Ave
- 25 Boulanger Ave
- 22 Levesque Ave