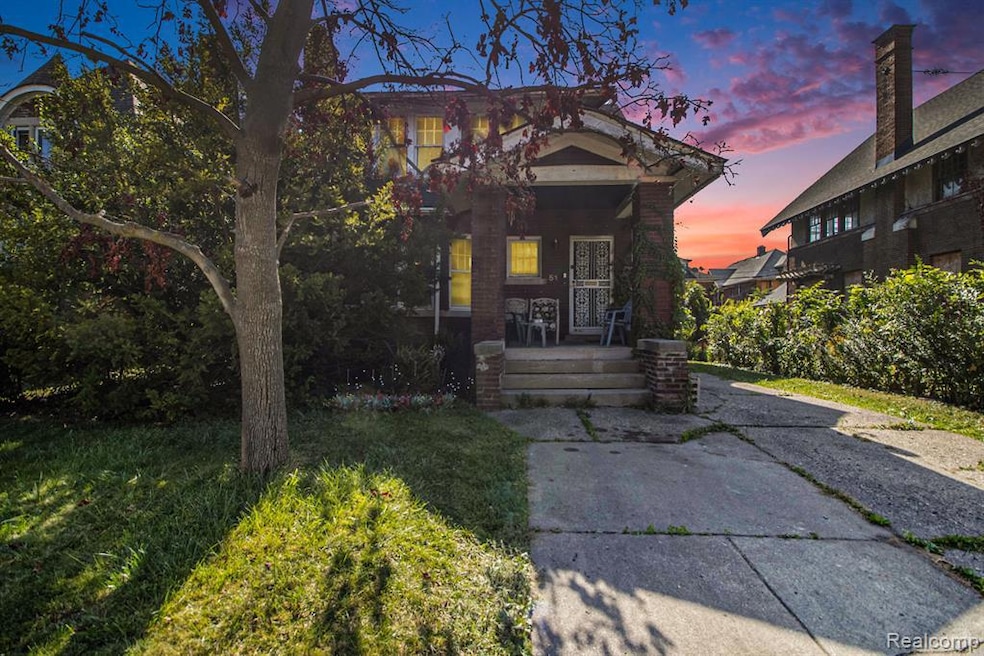
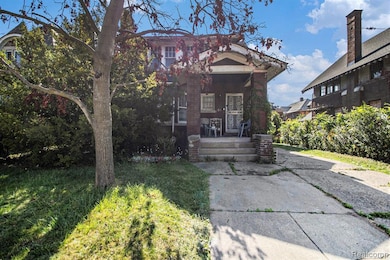
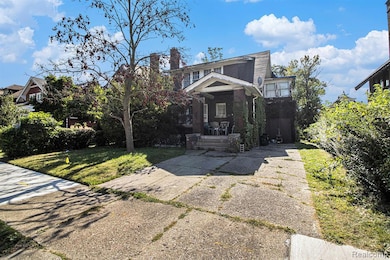
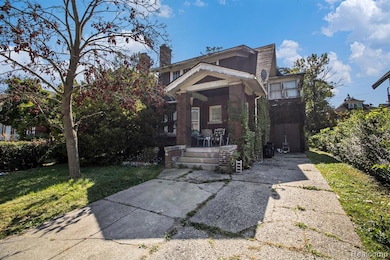
51 Puritan St Highland Park, MI 48203
Estimated payment $805/month
Highlights
- No HOA
- 1 Car Attached Garage
- Hot Water Heating System
- Covered Patio or Porch
- Bungalow
About This Home
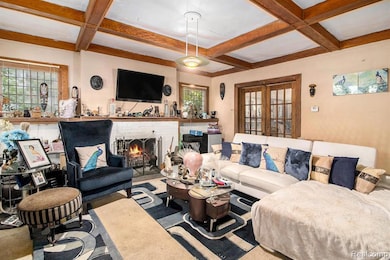
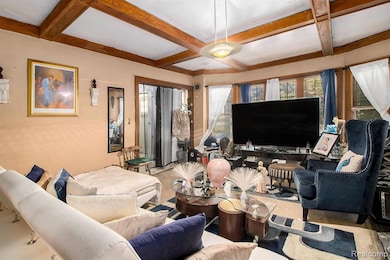
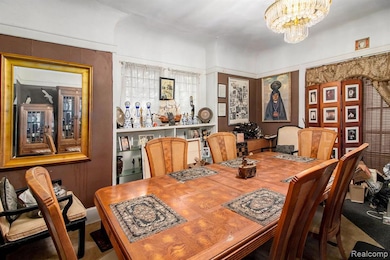
Welcome to this 4-bedroom, 1-bath brick Colonial, brimming with character and original charm! Situated on a spacious lot with a large yard, the classic charm starts with the covered front porch – a perfect place to unwind and enjoy the seasons. Step inside to a warm and inviting living room filled with natural light from multiple large windows is a cozy space with a fireplace, framed by rich, exposed wood ceiling beams that add architectural interest and historic elegance. Adjacent to the living area is a formal dining room, ideal for hosting family dinners or holiday gatherings, with plenty of room to entertain. The kitchen offers a functional layout and features a newer range. Upstairs, you’ll find four comfortable bedrooms with ample closet space and the full bathroom retains vintage touches while offering the potential for easy customization to suit your style. The full basement provides ample storage space, a laundry area, and plenty of potential to be finished into additional living space. Outside, enjoy a large backyard perfect for gardening, entertaining, or simply relaxing in your own private green space. The property also includes a detached 2-car garage, offering convenience and extra storage. Close to freeways for an easy commute as well as wonderful local shopping, dining and entertainment. This home offers historic charm making it a rare find for buyers seeking character, space, and a welcoming neighborhood feel. Whether you’re a first-time buyer or looking for a home to grow into, this home is full of possibilities. Schedule your private showing today!
Listing Agent
EXP Realty - Mark White & Associates License #6501439069 Listed on: 09/20/2025
Home Details
Home Type
- Single Family
Est. Annual Taxes
Year Built
- Built in 1914
Lot Details
- 5,227 Sq Ft Lot
- Lot Dimensions are 45x113
Parking
- 1 Car Attached Garage
Home Design
- Bungalow
- Brick Exterior Construction
- Block Foundation
Interior Spaces
- 1,916 Sq Ft Home
- 1.5-Story Property
- Living Room with Fireplace
- Unfinished Basement
Kitchen
- Free-Standing Gas Range
- Microwave
- Dishwasher
Bedrooms and Bathrooms
- 4 Bedrooms
- 1 Full Bathroom
Utilities
- Hot Water Heating System
- Heating System Uses Natural Gas
- Natural Gas Water Heater
Additional Features
- Covered Patio or Porch
- Ground Level
Community Details
- No Home Owners Association
- The Medbury Sub Subdivision
Listing and Financial Details
- Assessor Parcel Number 43003030753002
Map
Home Values in the Area
Average Home Value in this Area
Tax History
| Year | Tax Paid | Tax Assessment Tax Assessment Total Assessment is a certain percentage of the fair market value that is determined by local assessors to be the total taxable value of land and additions on the property. | Land | Improvement |
|---|---|---|---|---|
| 2025 | $913 | $55,200 | $0 | $0 |
| 2024 | $913 | $49,600 | $0 | $0 |
| 2023 | $877 | $44,300 | $0 | $0 |
| 2022 | $1,054 | $34,600 | $0 | $0 |
| 2021 | $1,035 | $23,500 | $0 | $0 |
| 2019 | $1,103 | $16,500 | $0 | $0 |
| 2018 | $901 | $13,600 | $0 | $0 |
| 2017 | $427 | $13,600 | $0 | $0 |
| 2016 | $1,302 | $14,300 | $0 | $0 |
| 2015 | $1,760 | $17,600 | $0 | $0 |
| 2013 | $2,510 | $25,100 | $0 | $0 |
| 2012 | $1,624 | $27,200 | $5,400 | $21,800 |
Property History
| Date | Event | Price | List to Sale | Price per Sq Ft |
|---|---|---|---|---|
| 10/14/2025 10/14/25 | Price Changed | $135,000 | -3.6% | $70 / Sq Ft |
| 09/20/2025 09/20/25 | For Sale | $140,000 | -- | $73 / Sq Ft |
Purchase History
| Date | Type | Sale Price | Title Company |
|---|---|---|---|
| Quit Claim Deed | -- | None Available | |
| Quit Claim Deed | $3,800 | None Available | |
| Interfamily Deed Transfer | -- | -- | |
| Deed | $55,838 | -- | |
| Deed | $19,000 | -- |
Source: Realcomp
MLS Number: 20251032373
APN: 43-003-03-0753-002
Disclaimer: Certain information contained herein is derived from information provided by parties other than Homes.com. All information provided is deemed reliable, but is not guaranteed to be accurate and should be independently verified.
![]() IDX provided courtesy of Realcomp II Ltd. via Ten-X and MLS
IDX provided courtesy of Realcomp II Ltd. via Ten-X and MLS
Copyright 2025 Realcomp II Ltd. Shareholders
IDX information is provided exclusively for consumers' personal, noncommercial use and may not be used for any purpose other than to identify prospective properties consumers may be interested in purchasing. The accuracy of all information, regardless of source, is not guaranteed or warranted. All information should be independently verified.
Listing Information presented by local MLS brokerage: Ten-X, local REALTOR®- Arlene Richardson - (888)-952-6393
- 10 Ferris St
- 132 Pilgrim St
- 20 Sears St
- 106 Geneva St
- 14350 2nd Ave
- 225 Covington Dr
- 33 Labelle St
- 242 Ferris St
- 757 Covington Dr
- 1000 Merton Rd Unit 2
- 1000 Merton Rd
- 1000 Merton Rd Unit 3
- 1000 Merton #5 Rd
- 885 Covington Dr
- 15608 Wabash St
- 59 W Margaret St
- 17520 Russell St
- 474 W Greendale
- 17765 Manderson Rd
- 16145 Baylis St
