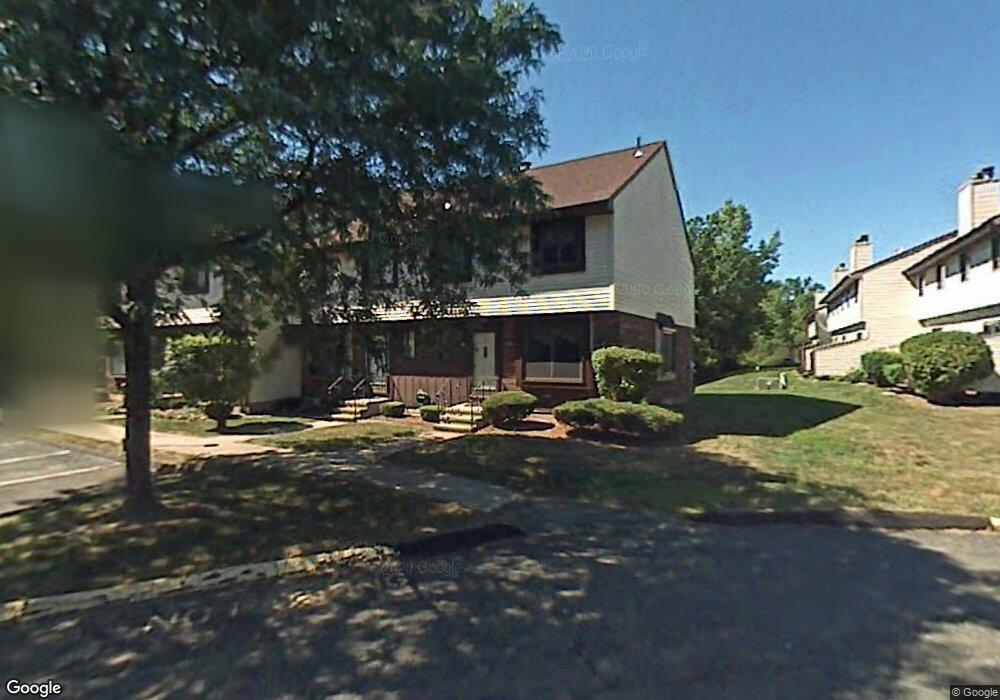
51 Robin Brook Dr Newington, CT 06111
Estimated Value: $271,000 - $313,000
2
Beds
2
Baths
1,460
Sq Ft
$199/Sq Ft
Est. Value
About This Home
This home is located at 51 Robin Brook Dr, Newington, CT 06111 and is currently estimated at $290,247, approximately $198 per square foot. 51 Robin Brook Dr is a home located in Hartford County with nearby schools including John Paterson School, John Wallace Middle School, and Newington High School.
Ownership History
Date
Name
Owned For
Owner Type
Purchase Details
Closed on
Mar 1, 2005
Sold by
Clarke Dabe A and Clarke Delseta L
Bought by
Dillon Bree
Current Estimated Value
Home Financials for this Owner
Home Financials are based on the most recent Mortgage that was taken out on this home.
Original Mortgage
$124,000
Outstanding Balance
$62,944
Interest Rate
5.73%
Estimated Equity
$227,303
Purchase Details
Closed on
Aug 28, 2000
Sold by
Dicioccio John J
Bought by
Clarke Dane A and Clarke Delseta L
Home Financials for this Owner
Home Financials are based on the most recent Mortgage that was taken out on this home.
Original Mortgage
$101,500
Interest Rate
8.06%
Purchase Details
Closed on
Mar 13, 1999
Sold by
Evans Donna M
Bought by
Dicioccio John J
Home Financials for this Owner
Home Financials are based on the most recent Mortgage that was taken out on this home.
Original Mortgage
$72,000
Interest Rate
6.73%
Create a Home Valuation Report for This Property
The Home Valuation Report is an in-depth analysis detailing your home's value as well as a comparison with similar homes in the area
Home Values in the Area
Average Home Value in this Area
Purchase History
| Date | Buyer | Sale Price | Title Company |
|---|---|---|---|
| Dillon Bree | $155,000 | -- | |
| Clarke Dane A | $108,500 | -- | |
| Dicioccio John J | $90,000 | -- |
Source: Public Records
Mortgage History
| Date | Status | Borrower | Loan Amount |
|---|---|---|---|
| Open | Dicioccio John J | $124,000 | |
| Previous Owner | Dicioccio John J | $20,699 | |
| Previous Owner | Dicioccio John J | $101,500 | |
| Previous Owner | Dicioccio John J | $72,000 |
Source: Public Records
Tax History
| Year | Tax Paid | Tax Assessment Tax Assessment Total Assessment is a certain percentage of the fair market value that is determined by local assessors to be the total taxable value of land and additions on the property. | Land | Improvement |
|---|---|---|---|---|
| 2025 | $4,321 | $108,090 | $0 | $108,090 |
| 2024 | $4,288 | $108,090 | $0 | $108,090 |
| 2023 | $4,146 | $108,090 | $0 | $108,090 |
| 2022 | $4,160 | $108,090 | $0 | $108,090 |
| 2021 | $4,195 | $108,090 | $0 | $108,090 |
| 2020 | $3,715 | $94,570 | $0 | $94,570 |
| 2019 | $3,731 | $94,570 | $0 | $94,570 |
| 2018 | $3,641 | $94,570 | $0 | $94,570 |
| 2017 | $3,460 | $94,570 | $0 | $94,570 |
| 2016 | $3,381 | $94,570 | $0 | $94,570 |
| 2014 | $3,971 | $114,210 | $0 | $114,210 |
Source: Public Records
Map
Nearby Homes
- 1471 Willard Ave Unit C
- 1473 Willard Ave Unit B
- 3 Steeplechase Dr
- 2950 Berlin Turnpike
- 2990 Berlin Turnpike
- 129 Glenview Dr
- 2 Deming Farm Dr Unit 2
- 55 Coles Ave
- 25 Coronado Dr
- 144 Churchill Dr
- 53 Coronado Dr Unit 53
- 495 New Britain Ave
- 417 Churchill Dr Unit 417
- 102 Winslow Dr
- 55 Cortland Way Unit 55
- 35 Woodsedge Dr Unit 4C
- 235 Lucille St
- 172 Eddy Ln
- 15 Woodsedge Dr Unit 5C
- 22 Mohawk Cir
- 52 Robin Brook Dr
- 31 Robin Brook Dr
- 54 Robin Brook Dr
- 55 Robin Brook Dr
- 55 Robin Brook Dr Unit 55
- 54 Robin Brook Dr Unit 54
- 52 Robin Brook Dr Unit 52
- 31 Robin Brook Dr Unit 31
- 53 Robin Brook Dr
- 42 Robin Brook Dr
- 42 Robin Brook Dr Unit 42
- 32 Robin Brook Dr
- 41 Robin Brook Dr
- 41 Robin Brook Dr Unit 41
- 19 Robin Brook Dr
- 45 Robin Brook Dr
- 45 Robin Brook Dr Unit 45
- 33 Robin Brook Dr
- 33 Robin Brook Dr Unit 33
- 44 Robin Brook Dr
Your Personal Tour Guide
Ask me questions while you tour the home.