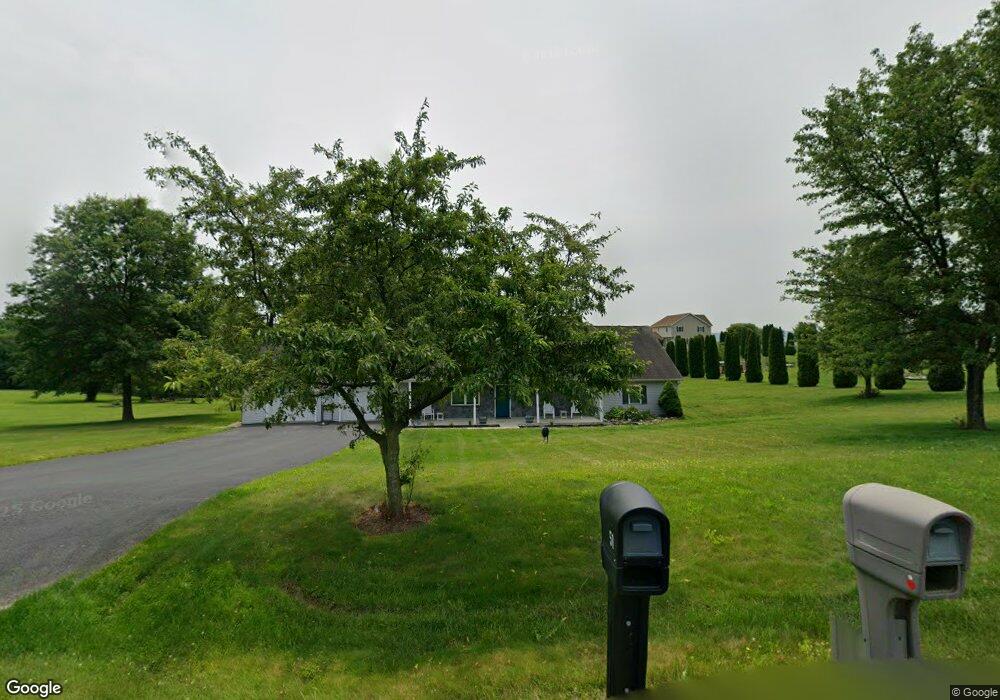
51 Rolling View Dr Schuylkill Haven, PA 17972
Estimated Value: $346,000 - $455,000
3
Beds
2
Baths
1,956
Sq Ft
$193/Sq Ft
Est. Value
About This Home
This home is located at 51 Rolling View Dr, Schuylkill Haven, PA 17972 and is currently estimated at $378,359, approximately $193 per square foot. 51 Rolling View Dr is a home located in Schuylkill County with nearby schools including Blue Mountain High School.
Ownership History
Date
Name
Owned For
Owner Type
Purchase Details
Closed on
Jul 14, 2020
Sold by
Borger Victoria Eve
Bought by
Borger Victoria Eve and Borger Craig
Current Estimated Value
Home Financials for this Owner
Home Financials are based on the most recent Mortgage that was taken out on this home.
Original Mortgage
$220,000
Outstanding Balance
$193,597
Interest Rate
2.7%
Mortgage Type
New Conventional
Estimated Equity
$184,762
Purchase Details
Closed on
Jul 27, 2018
Sold by
Weaver Jason and Weaver Jenny L
Bought by
Borger Victoria Eve
Purchase Details
Closed on
Jan 26, 2007
Sold by
Weaver Jenny L and Kreager Jenny Lynn
Bought by
Weaver Jenny L and Weaver Jason
Home Financials for this Owner
Home Financials are based on the most recent Mortgage that was taken out on this home.
Original Mortgage
$142,000
Interest Rate
8.15%
Mortgage Type
Adjustable Rate Mortgage/ARM
Create a Home Valuation Report for This Property
The Home Valuation Report is an in-depth analysis detailing your home's value as well as a comparison with similar homes in the area
Home Values in the Area
Average Home Value in this Area
Purchase History
| Date | Buyer | Sale Price | Title Company |
|---|---|---|---|
| Borger Victoria Eve | -- | Amrock Inc | |
| Borger Victoria Eve | $242,000 | Schuylkill Abstract Co Inc | |
| Weaver Jenny L | -- | None Available |
Source: Public Records
Mortgage History
| Date | Status | Borrower | Loan Amount |
|---|---|---|---|
| Open | Borger Victoria Eve | $220,000 | |
| Previous Owner | Weaver Jenny L | $142,000 |
Source: Public Records
Tax History
| Year | Tax Paid | Tax Assessment Tax Assessment Total Assessment is a certain percentage of the fair market value that is determined by local assessors to be the total taxable value of land and additions on the property. | Land | Improvement |
|---|---|---|---|---|
| 2025 | $4,422 | $69,150 | $12,725 | $56,425 |
| 2024 | $4,094 | $69,150 | $12,725 | $56,425 |
| 2023 | $4,094 | $69,150 | $12,725 | $56,425 |
| 2022 | $4,094 | $69,150 | $12,725 | $56,425 |
| 2021 | $4,027 | $69,150 | $12,725 | $56,425 |
| 2020 | $3,899 | $69,150 | $12,725 | $56,425 |
| 2018 | $3,750 | $69,150 | $12,725 | $56,425 |
| 2017 | $3,681 | $69,150 | $12,725 | $56,425 |
| 2015 | -- | $69,150 | $12,725 | $56,425 |
| 2011 | -- | $69,150 | $0 | $0 |
Source: Public Records
Map
Nearby Homes
- 15C Frieden Manor
- 0 Moon Hill Dr
- 0 S Route 183 Unit PASK130762
- 980 Horseman Dr
- 15 Earl Ave
- 981 Horseman Dr
- 988 Horseman Dr
- 238 Mohave Dr
- 7 N Oak Ln
- 1178 Custer Dr
- 174 Totem Dr
- 906 Wynonah Dr
- 1280 Doe Dr
- 141 Navajo Dr
- 1482 Bearcat Cove
- 1899 Long Run Rd
- 1489 Bearcat Cove
- 1881 Running Deer Dr
- 1865 and 1864 Buckaroo Dr
- 1751 Running Deer Dr
- 70 White Dog Dr
- 2 Wild Flower Dr
- 64 White Dog Dr
- 50 Rolling View Dr
- 42 Rolling View Dr
- 56 White Dog Dr
- 80 Rolling View Dr
- 16 White Dog Dr
- 83 Rolling View Dr
- 19 Wild Flower Dr
- 164 Rolling View Dr
- 30 White Dog Dr
- 152 Rolling View Dr
- 138 Rolling View Dr
- 132 Rolling View Dr
- 48 White Dog Dr
- 34 Rolling View Dr
- 148 Rolling View Dr
- 50 White Dog Dr
- 121 Rolling View Dr
Your Personal Tour Guide
Ask me questions while you tour the home.