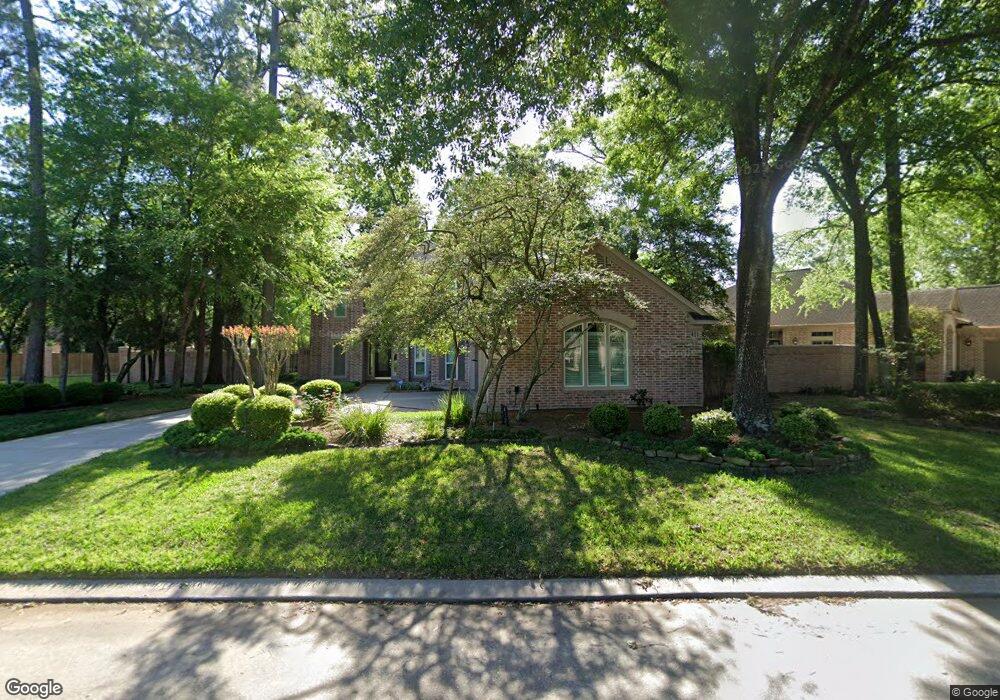
51 S Castlegreen Cir Spring, TX 77381
Cochran's Crossing NeighborhoodEstimated Value: $768,000 - $1,077,000
--
Bed
3
Baths
3,604
Sq Ft
$243/Sq Ft
Est. Value
About This Home
This home is located at 51 S Castlegreen Cir, Spring, TX 77381 and is currently estimated at $875,920, approximately $243 per square foot. 51 S Castlegreen Cir is a home located in Montgomery County with nearby schools including Galatas Elementary School, Mitchell Intermediate School, and McCullough Junior High School.
Ownership History
Date
Name
Owned For
Owner Type
Purchase Details
Closed on
Jun 30, 2011
Sold by
D R Horton Texas Ltd
Bought by
Koops Thomas Hancock and Koops Bonnie Ray
Current Estimated Value
Purchase Details
Closed on
Oct 16, 2000
Sold by
The Woodlands Land Development Co Lp
Bought by
Koops Thomas H and Koops Bonnie R
Purchase Details
Closed on
Jun 27, 1996
Sold by
Village Builders Inc
Bought by
Koops Thomas H and Koops Bonnie
Home Financials for this Owner
Home Financials are based on the most recent Mortgage that was taken out on this home.
Original Mortgage
$200,000
Interest Rate
8.1%
Purchase Details
Closed on
Dec 29, 1995
Sold by
Lennar Homes Of Texas Land And Construction L
Bought by
Koops Thomas H and Koops Bonnie
Purchase Details
Closed on
Sep 18, 1995
Sold by
Woodlands Land Dev Lp
Bought by
Koops Thomas H and Koops Bonnie
Create a Home Valuation Report for This Property
The Home Valuation Report is an in-depth analysis detailing your home's value as well as a comparison with similar homes in the area
Home Values in the Area
Average Home Value in this Area
Purchase History
| Date | Buyer | Sale Price | Title Company |
|---|---|---|---|
| Koops Thomas Hancock | -- | Dhi Title | |
| Koops Thomas H | -- | Stewart Title | |
| Koops Thomas H | -- | Stewart Title | |
| Koops Thomas H | -- | -- | |
| Koops Thomas H | -- | -- |
Source: Public Records
Mortgage History
| Date | Status | Borrower | Loan Amount |
|---|---|---|---|
| Previous Owner | Koops Thomas H | $200,000 |
Source: Public Records
Tax History Compared to Growth
Tax History
| Year | Tax Paid | Tax Assessment Tax Assessment Total Assessment is a certain percentage of the fair market value that is determined by local assessors to be the total taxable value of land and additions on the property. | Land | Improvement |
|---|---|---|---|---|
| 2025 | $5,256 | $670,037 | -- | -- |
| 2024 | $5,189 | $609,125 | -- | -- |
| 2023 | $5,189 | $553,750 | $80,000 | $473,750 |
| 2022 | $7,538 | $524,460 | $80,000 | $509,930 |
| 2021 | $10,482 | $476,780 | $41,330 | $435,450 |
| 2020 | $10,818 | $484,420 | $41,330 | $443,090 |
| 2019 | $10,791 | $467,810 | $41,330 | $426,480 |
| 2018 | $8,885 | $449,710 | $41,330 | $408,380 |
| 2017 | $10,505 | $449,710 | $41,330 | $408,380 |
| 2016 | $10,975 | $469,840 | $41,330 | $454,370 |
| 2015 | $7,961 | $427,130 | $41,330 | $392,680 |
| 2014 | $7,961 | $388,300 | $41,330 | $411,190 |
Source: Public Records
Map
Nearby Homes
- 14 Treestar Place
- 55 W Palmer Bend
- 23 Greentwig Place
- 31 Grey Birch Place
- 15 Amber Sky Place
- 50 E Copper Sage Cir
- 11 Amber Sky Place
- 64 Autumn Crescent
- 87 S Copper Sage Cir
- 6607 Lake Woodlands Dr Unit 224
- 6607 Lake Woodlands Dr Unit 223
- 6607 Lake Woodlands Dr Unit 322
- 6607 Lake Woodlands Dr Unit 334
- 143 W Village Knoll Cir
- 65 Hollymead Dr
- 23 W Bonny Branch St
- 24 Autumn Crescent
- Lot 85 Stock Pond Dr
- 111 Douvaine Ct
- 42 Tranquil Glade Place
- 55 S Castlegreen Cir
- 2 Greenside Place
- 47 N Castlegreen Cir
- 67 S Castlegreen Cir
- 7 Greenside Place
- 6 Greenside Place
- 43 N Castlegreen Cir
- 75 S Castlegreen Cir
- 54 S Castlegreen Cir
- 11 Greenside Place
- 58 S Castlegreen Cir
- 10 Greenside Place
- 79 S Castlegreen Cir
- 39 N Castlegreen Cir
- 62 S Castlegreen Cir
- 66 S Castlegreen Cir
- 2 E Palmer Bend
- 70 S Castlegreen Cir
- 14 Greenside Place
- 87 S Castlegreen Cir