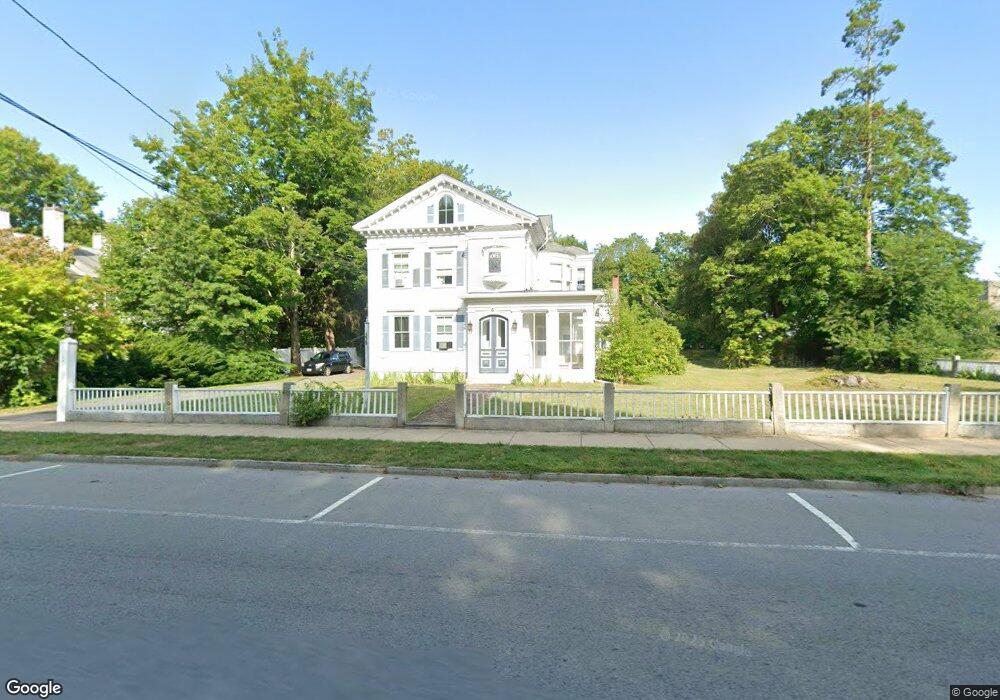
51 S Main St Unit 51 Middleboro, MA 02346
Estimated Value: $809,000 - $962,000
8
Beds
5
Baths
4,304
Sq Ft
$200/Sq Ft
Est. Value
About This Home
This home is located at 51 S Main St Unit 51, Middleboro, MA 02346 and is currently estimated at $861,653, approximately $200 per square foot. 51 S Main St Unit 51 is a home located in Plymouth County with nearby schools including Mary K. Goode Elementary School and Mullein Hill Christian Academy.
Ownership History
Date
Name
Owned For
Owner Type
Purchase Details
Closed on
Aug 4, 2017
Sold by
51 S Main St Rt
Bought by
Angelos Development Ll
Current Estimated Value
Home Financials for this Owner
Home Financials are based on the most recent Mortgage that was taken out on this home.
Original Mortgage
$250,000
Outstanding Balance
$208,267
Interest Rate
3.9%
Mortgage Type
New Conventional
Estimated Equity
$653,386
Purchase Details
Closed on
Nov 16, 2012
Sold by
Leonard Bradford S and Leonard Cheryl A
Bought by
51 S Main Street Rt
Home Financials for this Owner
Home Financials are based on the most recent Mortgage that was taken out on this home.
Original Mortgage
$245,000
Interest Rate
3.39%
Mortgage Type
New Conventional
Create a Home Valuation Report for This Property
The Home Valuation Report is an in-depth analysis detailing your home's value as well as a comparison with similar homes in the area
Home Values in the Area
Average Home Value in this Area
Purchase History
| Date | Buyer | Sale Price | Title Company |
|---|---|---|---|
| Angelos Development Ll | $475,000 | -- | |
| 51 S Main Street Rt | $350,000 | -- |
Source: Public Records
Mortgage History
| Date | Status | Borrower | Loan Amount |
|---|---|---|---|
| Open | Angelos Development Ll | $250,000 | |
| Previous Owner | 51 S Main Street Rt | $245,000 |
Source: Public Records
Tax History Compared to Growth
Tax History
| Year | Tax Paid | Tax Assessment Tax Assessment Total Assessment is a certain percentage of the fair market value that is determined by local assessors to be the total taxable value of land and additions on the property. | Land | Improvement |
|---|---|---|---|---|
| 2025 | $10,898 | $812,700 | $173,500 | $639,200 |
| 2024 | $10,397 | $767,900 | $165,300 | $602,600 |
| 2023 | $9,357 | $657,100 | $165,300 | $491,800 |
| 2022 | $8,700 | $565,700 | $143,700 | $422,000 |
| 2021 | $8,649 | $531,600 | $126,000 | $405,600 |
| 2020 | $8,312 | $523,400 | $126,000 | $397,400 |
| 2019 | $8,121 | $524,600 | $126,000 | $398,600 |
| 2018 | $7,597 | $487,000 | $120,000 | $367,000 |
| 2017 | $6,616 | $419,500 | $115,600 | $303,900 |
| 2016 | $6,675 | $419,300 | $105,700 | $313,600 |
| 2015 | $6,422 | $407,000 | $105,100 | $301,900 |
Source: Public Records
Map
Nearby Homes