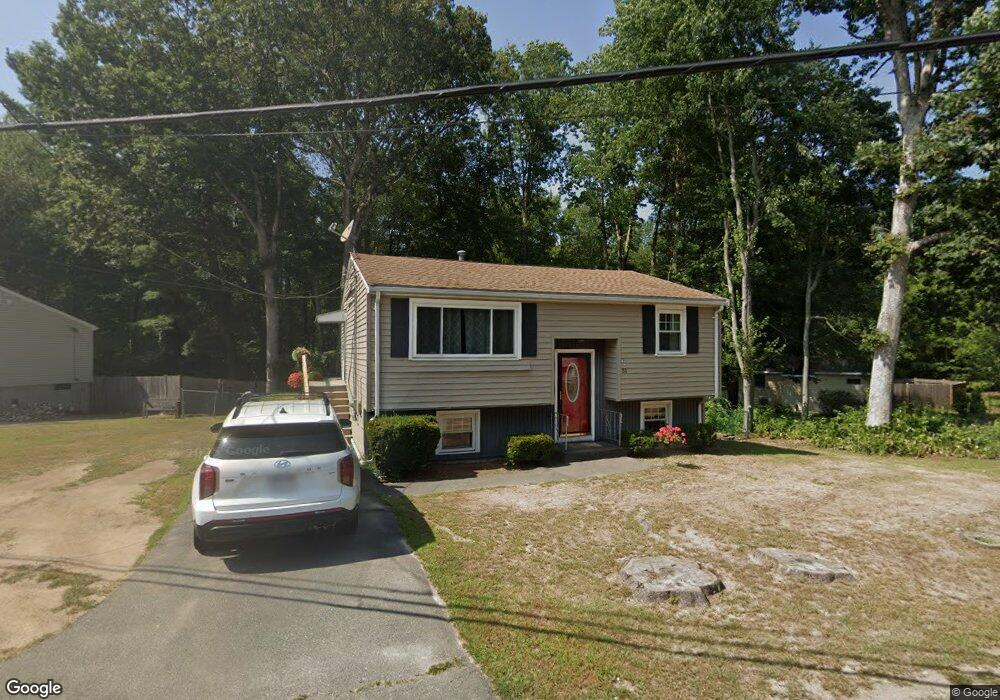
51 S Shore Rd Holbrook, MA 02343
Estimated Value: $458,000 - $542,000
2
Beds
1
Bath
1,128
Sq Ft
$438/Sq Ft
Est. Value
About This Home
This home is located at 51 S Shore Rd, Holbrook, MA 02343 and is currently estimated at $494,350, approximately $438 per square foot. 51 S Shore Rd is a home located in Norfolk County with nearby schools including John F. Kennedy Elementary School, Holbrook Middle High School, and Boston Higashi School.
Ownership History
Date
Name
Owned For
Owner Type
Purchase Details
Closed on
Aug 21, 2007
Sold by
Murphy Arlene R and Miller Ronald D
Bought by
Andrews Bobbi and Mcclellan Sean M
Current Estimated Value
Home Financials for this Owner
Home Financials are based on the most recent Mortgage that was taken out on this home.
Original Mortgage
$244,900
Outstanding Balance
$155,138
Interest Rate
6.67%
Mortgage Type
Purchase Money Mortgage
Estimated Equity
$339,212
Create a Home Valuation Report for This Property
The Home Valuation Report is an in-depth analysis detailing your home's value as well as a comparison with similar homes in the area
Home Values in the Area
Average Home Value in this Area
Purchase History
| Date | Buyer | Sale Price | Title Company |
|---|---|---|---|
| Andrews Bobbi | $254,900 | -- | |
| Andrews Bobbi | $254,900 | -- | |
| Andrews Bobbi | $254,900 | -- |
Source: Public Records
Mortgage History
| Date | Status | Borrower | Loan Amount |
|---|---|---|---|
| Open | Andrews Bobbi | $244,900 | |
| Closed | Andrews Bobbi | $244,900 |
Source: Public Records
Tax History Compared to Growth
Tax History
| Year | Tax Paid | Tax Assessment Tax Assessment Total Assessment is a certain percentage of the fair market value that is determined by local assessors to be the total taxable value of land and additions on the property. | Land | Improvement |
|---|---|---|---|---|
| 2025 | $51 | $383,300 | $195,800 | $187,500 |
| 2024 | $4,996 | $371,700 | $195,600 | $176,100 |
| 2023 | $5,283 | $343,500 | $177,800 | $165,700 |
| 2022 | $5,086 | $308,400 | $161,600 | $146,800 |
| 2021 | $4,916 | $285,500 | $146,700 | $138,800 |
| 2020 | $5,100 | $277,600 | $142,200 | $135,400 |
| 2019 | $4,997 | $256,800 | $133,100 | $123,700 |
| 2018 | $5,012 | $242,500 | $123,200 | $119,300 |
| 2017 | $4,715 | $225,600 | $111,900 | $113,700 |
| 2016 | $4,331 | $220,500 | $109,000 | $111,500 |
| 2015 | $4,032 | $211,300 | $104,300 | $107,000 |
| 2014 | $3,882 | $206,800 | $104,300 | $102,500 |
Source: Public Records
Map
Nearby Homes
- 13 Mayflower Rd
- 28 Border Rd
- 27 Ell Rd
- 14 Fern Rd
- 45 King Rd
- 25 Valley Rd
- 375 S Franklin St Unit 1
- 40 Overlook Rd
- 35 Marion St
- 181 S Franklin St Unit 102
- 88 Roseen Rd
- 719 S Franklin St Unit L Block 1
- 719 S Franklin St Unit D Block 1
- 719 S Franklin St Unit C Block 1
- 152 S Franklin St
- 68 Spring St
- 29 Belair Dr
- 58 Woodlawn Rd
- 4 Evan Cain Way
- 43 Toscano Way Unit 43