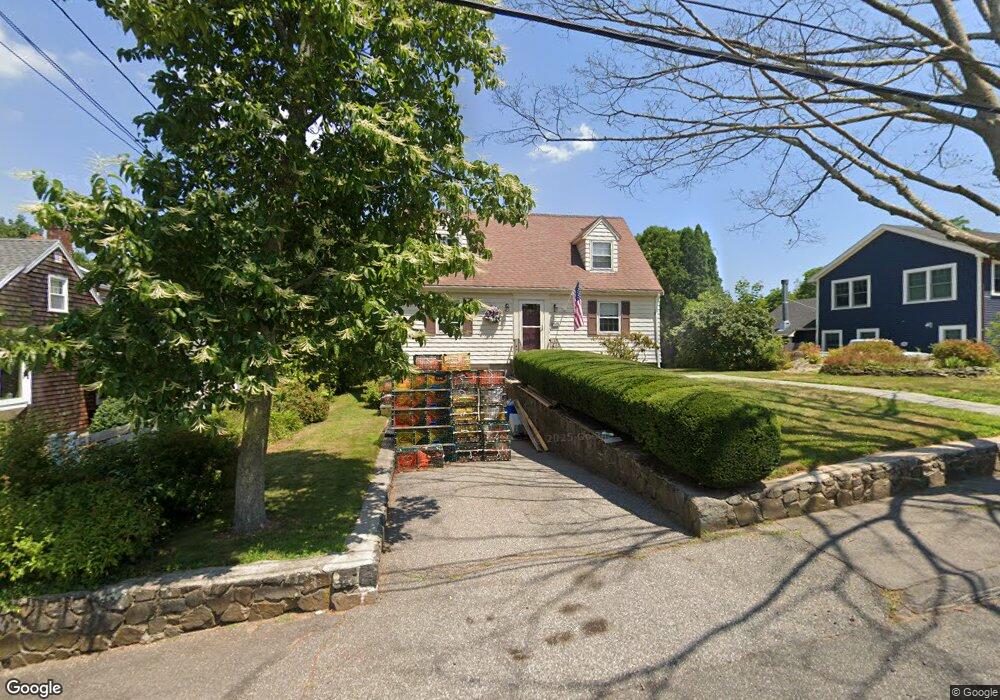
51 Stony Brook Rd Unit 51 Marblehead, MA 01945
Estimated Value: $855,000 - $1,005,000
3
Beds
2
Baths
1,600
Sq Ft
$567/Sq Ft
Est. Value
About This Home
This home is located at 51 Stony Brook Rd Unit 51, Marblehead, MA 01945 and is currently estimated at $907,797, approximately $567 per square foot. 51 Stony Brook Rd Unit 51 is a home located in Essex County with nearby schools including Marblehead High School, Marblehead Community Charter Public School, and Devereux School.
Ownership History
Date
Name
Owned For
Owner Type
Purchase Details
Closed on
Mar 31, 2022
Sold by
Mary F Withum T
Bought by
Martin Dirk D and Martin Tara J
Current Estimated Value
Home Financials for this Owner
Home Financials are based on the most recent Mortgage that was taken out on this home.
Original Mortgage
$624,000
Outstanding Balance
$588,661
Interest Rate
4.67%
Mortgage Type
Purchase Money Mortgage
Estimated Equity
$319,136
Purchase Details
Closed on
Oct 24, 2018
Sold by
Withum Mary F
Bought by
Mary F Witham T F and Mary Withum
Purchase Details
Closed on
Aug 14, 2012
Sold by
Withum Margaret B
Bought by
Withum Mary F and Withum Margaret B
Purchase Details
Closed on
Oct 30, 2008
Sold by
Withum Margaret B
Bought by
Withum William E
Purchase Details
Closed on
Jan 4, 2008
Sold by
Withum Margaret B and Withum William E
Bought by
Withum Margaret B
Create a Home Valuation Report for This Property
The Home Valuation Report is an in-depth analysis detailing your home's value as well as a comparison with similar homes in the area
Home Values in the Area
Average Home Value in this Area
Purchase History
| Date | Buyer | Sale Price | Title Company |
|---|---|---|---|
| Martin Dirk D | $800,000 | None Available | |
| Mary F Witham T F | -- | -- | |
| Mary F Withum T F | -- | -- | |
| Mary F Withum T | -- | -- | |
| Withum Mary F | -- | -- | |
| Withum Mary F | -- | -- | |
| Withum Mary F | -- | -- | |
| Withum William E | -- | -- | |
| Withum Margaret B | -- | -- | |
| Withum Margaret B | -- | -- | |
| Withum Margaret B | -- | -- | |
| Withum Margaret B | -- | -- | |
| Withum Margaret B | -- | -- |
Source: Public Records
Mortgage History
| Date | Status | Borrower | Loan Amount |
|---|---|---|---|
| Open | Martin Dirk D | $624,000 | |
| Closed | Martin Dirk D | $624,000 |
Source: Public Records
Tax History Compared to Growth
Tax History
| Year | Tax Paid | Tax Assessment Tax Assessment Total Assessment is a certain percentage of the fair market value that is determined by local assessors to be the total taxable value of land and additions on the property. | Land | Improvement |
|---|---|---|---|---|
| 2025 | $6,973 | $770,500 | $555,600 | $214,900 |
| 2024 | $5,982 | $667,600 | $530,900 | $136,700 |
| 2023 | $6,585 | $658,500 | $506,200 | $152,300 |
| 2022 | $5,937 | $564,400 | $413,600 | $150,800 |
| 2021 | $5,688 | $545,900 | $395,100 | $150,800 |
| 2020 | $5,442 | $523,800 | $395,100 | $128,700 |
| 2019 | $5,212 | $485,300 | $358,000 | $127,300 |
| 2018 | $5,076 | $460,600 | $333,300 | $127,300 |
| 2017 | $4,664 | $423,600 | $296,300 | $127,300 |
| 2016 | $4,565 | $411,300 | $284,000 | $127,300 |
| 2015 | $4,348 | $392,400 | $271,600 | $120,800 |
| 2014 | -- | $352,500 | $234,600 | $117,900 |
Source: Public Records
Map
Nearby Homes
- 20 Cheever Ave
- 37 Peach Highlands
- 44 Peach Highlands
- 19 Mill Pond
- 24 Russell St
- 105 Green St Unit 4
- 31 Lincoln Park
- 51 Lincoln Ave
- 3 Anchorage Ln
- 1 Elm St
- 3 Frost Ln Unit 1
- 25 Pearl St
- 1 Green St Unit 2
- 60 Elm St
- 20 Mechanic Square Unit 3
- 20 Mechanic Square Unit 2
- 8 Franklin St Unit 19
- 3 Doaks Ln
- 4 Broadmere Way
- 2 Ocean Meadow Ln
- 51 Stony Brook Rd
- 53 Stony Brook Rd
- 49 Stony Brook Rd
- 47 Stony Brook Rd
- 38 Blueberry Rd
- 50 Stony Brook Rd Unit 6
- 50 Stony Brook Rd Unit 5
- 50 Stony Brook Rd Unit 4
- 50 Stony Brook Rd Unit 3
- 50 Stony Brook Rd Unit 2
- 50 Stony Brook Rd Unit 1
- 43 Stony Brook Rd
- 34 Blueberry Rd
- 33 Blueberry Rd
- 41 Stony Brook Rd
- 44 Stony Brook Rd
- 44 Stony Brook Rd Unit 2
- 52 Stony Brook Rd Unit 3
- 52 Stony Brook Rd Unit 2
- 52 Stony Brook Rd Unit 1