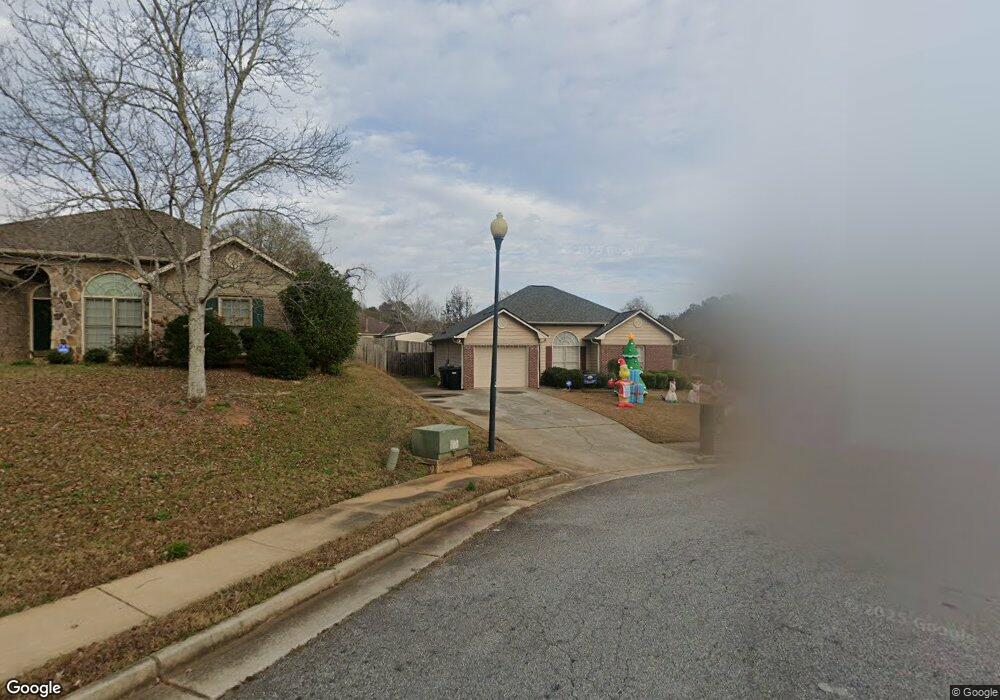
51 Sugar Mill Ct Columbus, GA 31909
Northern Columbus NeighborhoodEstimated Value: $235,000 - $249,000
3
Beds
3
Baths
1,519
Sq Ft
$159/Sq Ft
Est. Value
About This Home
This home is located at 51 Sugar Mill Ct, Columbus, GA 31909 and is currently estimated at $241,450, approximately $158 per square foot. 51 Sugar Mill Ct is a home located in Muscogee County with nearby schools including Eagle Ridge Academy, Blackmon Road Middle School, and Shaw High School.
Ownership History
Date
Name
Owned For
Owner Type
Purchase Details
Closed on
Jul 25, 2014
Sold by
Labady Antony
Bought by
Jackson Janeigha L
Current Estimated Value
Home Financials for this Owner
Home Financials are based on the most recent Mortgage that was taken out on this home.
Original Mortgage
$147,283
Outstanding Balance
$112,563
Interest Rate
4.25%
Mortgage Type
FHA
Estimated Equity
$128,887
Purchase Details
Closed on
May 26, 2010
Sold by
Labady Antony
Bought by
Labady Antony and Labady Farnese
Home Financials for this Owner
Home Financials are based on the most recent Mortgage that was taken out on this home.
Original Mortgage
$169,375
Interest Rate
5.12%
Mortgage Type
FHA
Purchase Details
Closed on
Apr 26, 2010
Sold by
Holbert Kevin R
Bought by
Labady Antony
Home Financials for this Owner
Home Financials are based on the most recent Mortgage that was taken out on this home.
Original Mortgage
$169,375
Interest Rate
5.12%
Mortgage Type
FHA
Create a Home Valuation Report for This Property
The Home Valuation Report is an in-depth analysis detailing your home's value as well as a comparison with similar homes in the area
Home Values in the Area
Average Home Value in this Area
Purchase History
| Date | Buyer | Sale Price | Title Company |
|---|---|---|---|
| Jackson Janeigha L | $150,000 | -- | |
| Labady Antony | -- | None Available | |
| Labady Antony | $172,500 | None Available |
Source: Public Records
Mortgage History
| Date | Status | Borrower | Loan Amount |
|---|---|---|---|
| Open | Jackson Janeigha L | $147,283 | |
| Previous Owner | Labady Antony | $169,375 |
Source: Public Records
Tax History Compared to Growth
Tax History
| Year | Tax Paid | Tax Assessment Tax Assessment Total Assessment is a certain percentage of the fair market value that is determined by local assessors to be the total taxable value of land and additions on the property. | Land | Improvement |
|---|---|---|---|---|
| 2025 | $1,869 | $80,536 | $14,388 | $66,148 |
| 2024 | $187 | $80,536 | $14,388 | $66,148 |
| 2023 | $1,185 | $80,536 | $14,388 | $66,148 |
| 2022 | $1,947 | $65,096 | $14,388 | $50,708 |
| 2021 | $1,941 | $61,072 | $14,388 | $46,684 |
| 2020 | $1,941 | $61,072 | $14,388 | $46,684 |
| 2019 | $1,949 | $61,072 | $14,388 | $46,684 |
| 2018 | $1,949 | $61,072 | $14,388 | $46,684 |
| 2017 | $1,919 | $60,156 | $14,388 | $45,768 |
| 2016 | $1,928 | $60,000 | $11,600 | $48,400 |
| 2015 | $1,930 | $60,000 | $11,600 | $48,400 |
| 2014 | $2,847 | $68,844 | $11,600 | $57,244 |
| 2013 | -- | $68,844 | $11,600 | $57,244 |
Source: Public Records
Map
Nearby Homes
- 5041 Montego Dr
- 5042 Foxfire Dr
- 5045 Old Post Rd
- 209 Plum Ct
- 5011 Montego Dr
- 6528 Yellow Stone Ct
- 6630 Lemans Ln
- 5378 Misty Ln
- 6500 Charter Oaks Cir
- 6333 Stony Creek Dr
- 4715 Teak Dr
- 6137 Stoneway Dr
- 4627 Wimbish Ct
- 6263 Potomac Cir
- 6 Jamestown Ct
- 6736 Charter Oaks Cir
- 6127 Stony Creek Dr
- 7020 Stoneridge Cir
- 6251 Rockefeller Dr
- 7076 Stoneybrook Dr
- 47 Sugar Mill Ct
- 55 Sugar Mill Ct
- 1022 Sugar Mill Dr
- 43 Sugar Mill Ct
- 1024 Sugar Mill Dr
- 1018 Sugar Mill Dr
- 52 Sugar Mill Ct
- 1026 Sugar Mill Dr
- 33 Sugar Mill Ct
- 6487 Field Stream Way
- 1016 Sugar Mill Dr
- 46 Sugar Mill Ct
- 1028 Sugar Mill Dr
- 21 Sugar Mill Ct
- 42 Sugar Mill Ct
- 50 Sugar Mill Ct
- 6 Summerbrook Ct
- 1014 Sugar Mill Dr
- 38 Sugar Mill Ct
- 1021 Sugar Mill Dr