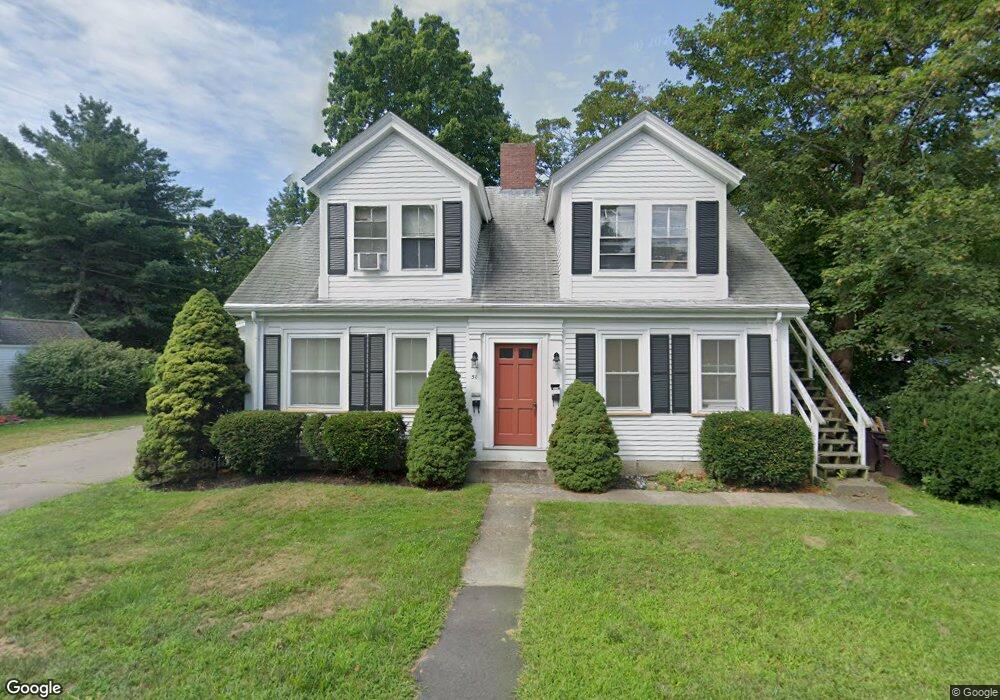
51 Summer St Weymouth, MA 02188
Weymouth Landing NeighborhoodEstimated Value: $728,000 - $813,356
--
Bed
3
Baths
2,328
Sq Ft
$329/Sq Ft
Est. Value
About This Home
This home is located at 51 Summer St, Weymouth, MA 02188 and is currently estimated at $766,089, approximately $329 per square foot. 51 Summer St is a home located in Norfolk County with nearby schools including Frederick C Murphy, Abigail Adams Middle School, and Weymouth Middle School Chapman.
Ownership History
Date
Name
Owned For
Owner Type
Purchase Details
Closed on
Feb 1, 2022
Sold by
51 Summer St T and Hoffman
Bought by
Hoffman Hannah N
Current Estimated Value
Home Financials for this Owner
Home Financials are based on the most recent Mortgage that was taken out on this home.
Original Mortgage
$544,000
Outstanding Balance
$502,573
Interest Rate
3.45%
Mortgage Type
Purchase Money Mortgage
Estimated Equity
$263,516
Create a Home Valuation Report for This Property
The Home Valuation Report is an in-depth analysis detailing your home's value as well as a comparison with similar homes in the area
Home Values in the Area
Average Home Value in this Area
Purchase History
| Date | Buyer | Sale Price | Title Company |
|---|---|---|---|
| Hoffman Hannah N | $680,000 | None Available |
Source: Public Records
Mortgage History
| Date | Status | Borrower | Loan Amount |
|---|---|---|---|
| Open | Hoffman Hannah N | $544,000 |
Source: Public Records
Tax History Compared to Growth
Tax History
| Year | Tax Paid | Tax Assessment Tax Assessment Total Assessment is a certain percentage of the fair market value that is determined by local assessors to be the total taxable value of land and additions on the property. | Land | Improvement |
|---|---|---|---|---|
| 2025 | $5,746 | $568,900 | $207,800 | $361,100 |
| 2024 | $5,566 | $542,000 | $197,900 | $344,100 |
| 2023 | $5,406 | $517,300 | $183,300 | $334,000 |
| 2022 | $5,251 | $458,200 | $169,700 | $288,500 |
| 2021 | $5,168 | $440,200 | $169,700 | $270,500 |
| 2020 | $4,999 | $419,400 | $169,700 | $249,700 |
| 2019 | $4,876 | $402,300 | $163,200 | $239,100 |
| 2018 | $4,596 | $367,700 | $155,400 | $212,300 |
| 2017 | $4,364 | $340,700 | $148,000 | $192,700 |
| 2016 | $4,077 | $318,500 | $142,300 | $176,200 |
| 2015 | $3,906 | $302,800 | $142,300 | $160,500 |
| 2014 | $3,743 | $281,400 | $132,400 | $149,000 |
Source: Public Records
Map
Nearby Homes
- 15 Summer St
- 76 Kingman St
- 16 Lindbergh Ave
- 23-25 Lindbergh Ave
- 33 Congress St
- 48 Apple Tree Ln
- 24 Blake Rd
- 11 Richmond St
- 54 Federal St
- 122 Washington St Unit 22
- 114 Broad St Unit D
- 114 Broad St Unit C
- 19 Vine St Unit 3
- 19 Vine St Unit 1
- 36 Brookside Rd
- 37 Lantern Ln
- 51 Faxon St
- 97 Liberty St
- 141 Commercial St Unit 9
- 230 Lisle St
- 51 Summer St Unit 3
- 51 Summer St Unit 2
- 59 Summer St
- 43 Summer St
- 6 Off Summer St Unit SUMMER
- 6 Off Summer St Unit 2
- 48 Summer St
- 54 Summer St
- 44 Summer St
- 65 Summer St
- 35 Summer St
- 35 Summer St Unit 4
- 35 Summer St Unit 3
- 35 Summer St Unit 1
- 22 Garfield Ave
- 34 Summer St
- 34 Summer St Unit 34
- 60 Summer St
- 32 Garfield Ave
- 27 Summer St