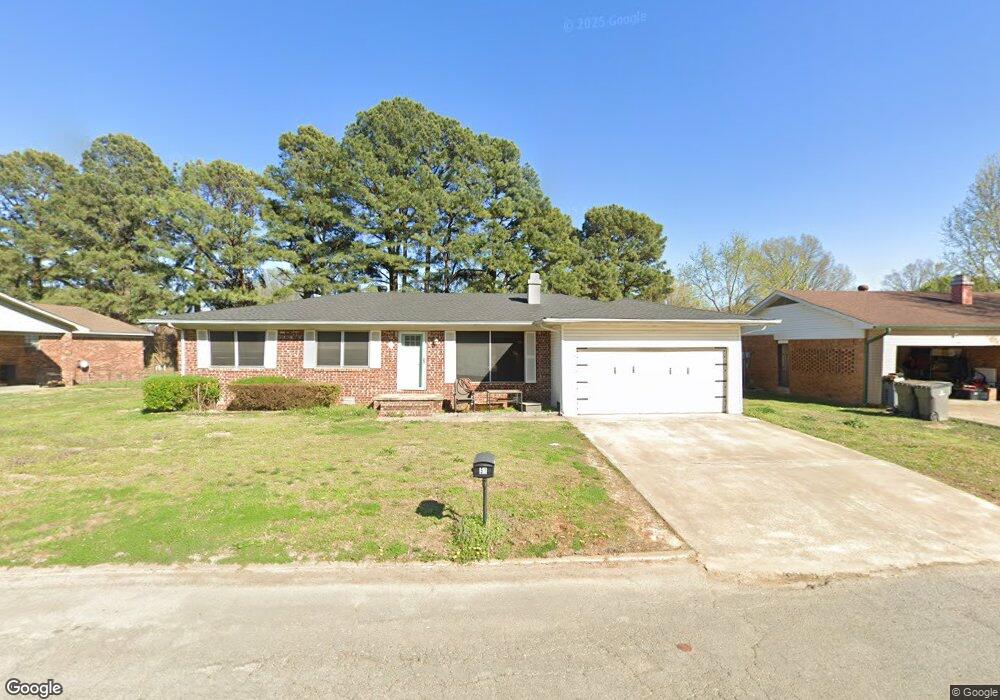
51 Sundale St Paragould, AR 72450
Estimated Value: $142,000 - $168,508
--
Bed
2
Baths
1,518
Sq Ft
$103/Sq Ft
Est. Value
About This Home
This home is located at 51 Sundale St, Paragould, AR 72450 and is currently estimated at $155,877, approximately $102 per square foot. 51 Sundale St is a home located in Greene County with nearby schools including Paragould High School and St. Mary's Catholic School & Preschool.
Ownership History
Date
Name
Owned For
Owner Type
Purchase Details
Closed on
Nov 18, 2022
Sold by
Crawley Gene and Crawley Allison
Bought by
Cox Alexis
Current Estimated Value
Purchase Details
Closed on
May 5, 2022
Sold by
Fulton Alicia N and Fulton William L
Bought by
Crawley Gene and Crawley Allison
Purchase Details
Closed on
Jun 15, 2020
Sold by
Ryles Kathryn and Ryles Floyd
Bought by
Fulton Alicia N and Fulton William L
Home Financials for this Owner
Home Financials are based on the most recent Mortgage that was taken out on this home.
Original Mortgage
$116,666
Interest Rate
3.2%
Mortgage Type
New Conventional
Purchase Details
Closed on
Nov 25, 2014
Bought by
Trayler Bernard and Trayler Kathryn
Purchase Details
Closed on
Sep 20, 2013
Sold by
Wolfe Julie Shannon and The Estate Of Orval Eugene Sha
Bought by
Kelly Bob and Kelly Suzanne
Purchase Details
Closed on
Apr 4, 1997
Bought by
Orval E Shannon
Create a Home Valuation Report for This Property
The Home Valuation Report is an in-depth analysis detailing your home's value as well as a comparison with similar homes in the area
Home Values in the Area
Average Home Value in this Area
Purchase History
| Date | Buyer | Sale Price | Title Company |
|---|---|---|---|
| Cox Alexis | $112,900 | -- | |
| Crawley Gene | $160,000 | -- | |
| Fulton Alicia N | $115,000 | Ajax Title Services | |
| Trayler Bernard | $83,500 | -- | |
| Kelly Bob | $77,500 | None Available | |
| Orval E Shannon | $65,000 | -- |
Source: Public Records
Mortgage History
| Date | Status | Borrower | Loan Amount |
|---|---|---|---|
| Previous Owner | Fulton Alicia N | $116,666 |
Source: Public Records
Tax History Compared to Growth
Tax History
| Year | Tax Paid | Tax Assessment Tax Assessment Total Assessment is a certain percentage of the fair market value that is determined by local assessors to be the total taxable value of land and additions on the property. | Land | Improvement |
|---|---|---|---|---|
| 2025 | $1,249 | $30,730 | $3,300 | $27,430 |
| 2024 | $1,149 | $30,730 | $3,300 | $27,430 |
| 2023 | $1,005 | $21,830 | $3,400 | $18,430 |
| 2022 | $630 | $21,830 | $3,400 | $18,430 |
| 2021 | $630 | $21,830 | $3,400 | $18,430 |
| 2020 | $754 | $17,220 | $3,400 | $13,820 |
| 2019 | $379 | $17,220 | $3,400 | $13,820 |
| 2018 | $404 | $17,220 | $3,400 | $13,820 |
| 2017 | $731 | $17,220 | $3,400 | $13,820 |
| 2016 | $381 | $17,220 | $3,400 | $13,820 |
| 2015 | $381 | $16,390 | $3,000 | $13,390 |
| 2014 | $737 | $16,390 | $3,000 | $13,390 |
Source: Public Records
Map
Nearby Homes
- 1811 Magnolia Ln
- 2001 W Kingshighway
- 1905 Glendale St
- 1701 Barnhill Rd
- 1103 Summit Ridge Trail
- 1101 Summit Ridge Trail
- 1103 Summit Ridge Dr
- 2311 S 20th St
- 1104 Summit Ridge Dr
- 1700 Barnhill Rd
- 1801 Sara Ann Cir
- 2075 S 141 Hwy
- 3.65 ACRES U S 49
- 412 Magnolia Dr
- 4063 GRE 934 Rd
- 106 Magnolia Dr
- 102 Magnolia Dr
- 3200 Red Oak Dr
- 3202 Red Oak Dr
- 1901 Marlanita Dr
- 53 Sundale Cir
- 51 Sundale Cir
- 56 Sundale Cir
- 49 Sundale Cir
- 54 Sundale Cir
- 58 Sundale Cir
- 55 Sundale Cir
- 52 Sundale Cir
- 8 Donna Lynn Dr
- 60 Sundale Cir
- 50 Sundale Cir
- 4 Donna Lynn Dr
- 10 Donna Lynn Dr
- 57 Sundale Cir
- 45 Sundale Cir
- 43 Sundale Cir
- 62 Sundale Cir
- 48 Sundale Cir
- 41 Sundale Cir
- 64 Sundale Cir