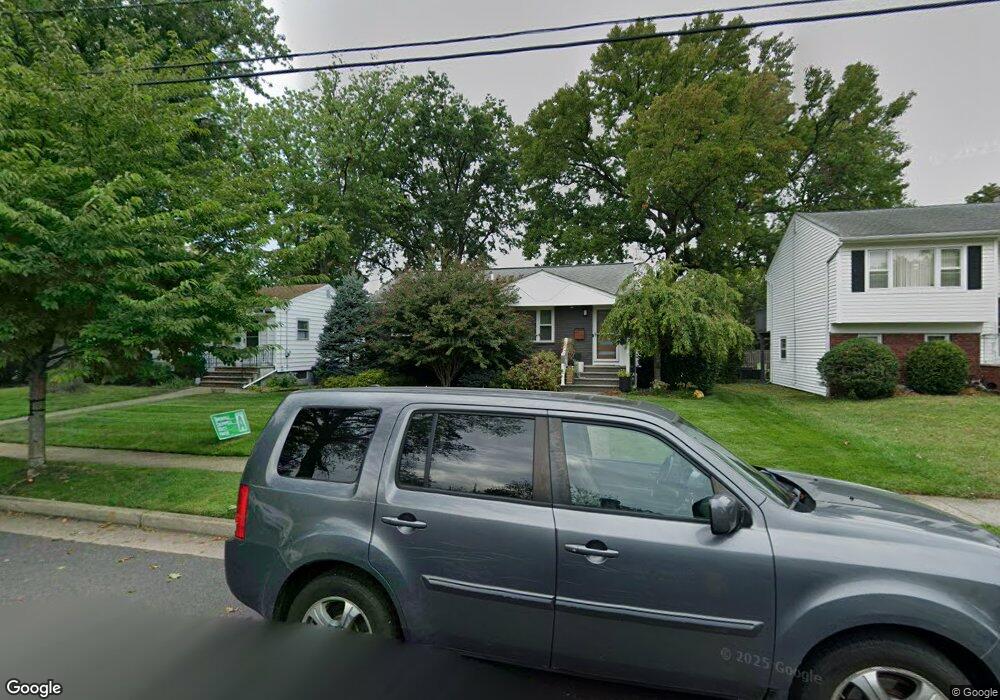
51 Talmadge Ave Metuchen, NJ 08840
Estimated Value: $642,916 - $701,000
3
Beds
2
Baths
910
Sq Ft
$730/Sq Ft
Est. Value
About This Home
This home is located at 51 Talmadge Ave, Metuchen, NJ 08840 and is currently estimated at $664,729, approximately $730 per square foot. 51 Talmadge Ave is a home located in Middlesex County with nearby schools including Campbell Elementary School, Edgar Middle School, and Metuchen High School.
Ownership History
Date
Name
Owned For
Owner Type
Purchase Details
Closed on
Mar 25, 2011
Sold by
51 Holly Road Associates Llc
Bought by
Delia Jason A and Delia Courtney A
Current Estimated Value
Home Financials for this Owner
Home Financials are based on the most recent Mortgage that was taken out on this home.
Original Mortgage
$280,000
Interest Rate
4.99%
Mortgage Type
New Conventional
Purchase Details
Closed on
Jul 31, 2007
Sold by
Davidson Vanessa D
Bought by
Zielke Jessica D
Create a Home Valuation Report for This Property
The Home Valuation Report is an in-depth analysis detailing your home's value as well as a comparison with similar homes in the area
Home Values in the Area
Average Home Value in this Area
Purchase History
| Date | Buyer | Sale Price | Title Company |
|---|---|---|---|
| Delia Jason A | $330,000 | Old Republic National Title | |
| Zielke Jessica D | -- | -- |
Source: Public Records
Mortgage History
| Date | Status | Borrower | Loan Amount |
|---|---|---|---|
| Previous Owner | Delia Jason A | $280,000 |
Source: Public Records
Tax History Compared to Growth
Tax History
| Year | Tax Paid | Tax Assessment Tax Assessment Total Assessment is a certain percentage of the fair market value that is determined by local assessors to be the total taxable value of land and additions on the property. | Land | Improvement |
|---|---|---|---|---|
| 2025 | $9,946 | $143,000 | $81,000 | $62,000 |
| 2024 | $9,142 | $143,000 | $81,000 | $62,000 |
| 2023 | $9,142 | $136,000 | $81,000 | $55,000 |
| 2022 | $8,665 | $136,000 | $81,000 | $55,000 |
| 2021 | $8,466 | $136,000 | $81,000 | $55,000 |
| 2020 | $8,354 | $136,000 | $81,000 | $55,000 |
| 2019 | $8,108 | $136,000 | $81,000 | $55,000 |
| 2018 | $8,078 | $136,000 | $81,000 | $55,000 |
| 2017 | $7,934 | $134,000 | $81,000 | $53,000 |
| 2016 | $7,674 | $133,000 | $81,000 | $52,000 |
| 2015 | $7,464 | $132,300 | $80,800 | $51,500 |
| 2014 | $7,278 | $132,300 | $80,800 | $51,500 |
Source: Public Records
Map
Nearby Homes