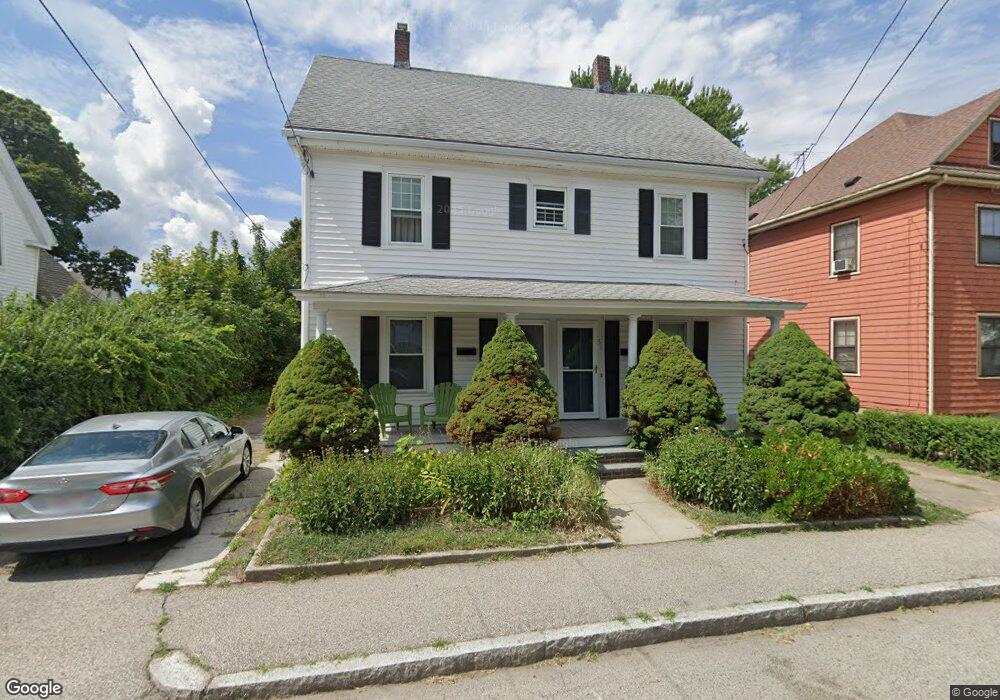
51 Trafford St Quincy, MA 02169
South Quincy NeighborhoodEstimated Value: $766,000 - $933,000
6
Beds
3
Baths
2,292
Sq Ft
$375/Sq Ft
Est. Value
About This Home
This home is located at 51 Trafford St, Quincy, MA 02169 and is currently estimated at $858,696, approximately $374 per square foot. 51 Trafford St is a home located in Norfolk County with nearby schools including South West Middle School, Lincoln-Hancock Community School, and Quincy High School.
Ownership History
Date
Name
Owned For
Owner Type
Purchase Details
Closed on
Aug 28, 2023
Sold by
Kennally John B and Kennally Cynthia A
Bought by
Kennally
Current Estimated Value
Purchase Details
Closed on
Aug 28, 2003
Sold by
Kennally Cynthia A and Kennally John B
Bought by
Kennally John B and Kennally Cynthia A
Home Financials for this Owner
Home Financials are based on the most recent Mortgage that was taken out on this home.
Original Mortgage
$240,000
Interest Rate
5.69%
Mortgage Type
Purchase Money Mortgage
Create a Home Valuation Report for This Property
The Home Valuation Report is an in-depth analysis detailing your home's value as well as a comparison with similar homes in the area
Home Values in the Area
Average Home Value in this Area
Purchase History
| Date | Buyer | Sale Price | Title Company |
|---|---|---|---|
| Kennally | -- | None Available | |
| Kennally John B | $220,000 | -- |
Source: Public Records
Mortgage History
| Date | Status | Borrower | Loan Amount |
|---|---|---|---|
| Previous Owner | Kennally John B | $207,500 | |
| Previous Owner | Kennally John B | $240,000 |
Source: Public Records
Tax History Compared to Growth
Tax History
| Year | Tax Paid | Tax Assessment Tax Assessment Total Assessment is a certain percentage of the fair market value that is determined by local assessors to be the total taxable value of land and additions on the property. | Land | Improvement |
|---|---|---|---|---|
| 2025 | $8,433 | $731,400 | $285,000 | $446,400 |
| 2024 | $7,952 | $705,600 | $271,400 | $434,200 |
| 2023 | $7,578 | $680,900 | $246,700 | $434,200 |
| 2022 | $7,483 | $624,600 | $205,600 | $419,000 |
| 2021 | $7,091 | $584,100 | $205,600 | $378,500 |
| 2020 | $7,259 | $584,000 | $205,600 | $378,400 |
| 2019 | $6,437 | $512,900 | $194,000 | $318,900 |
| 2018 | $6,234 | $467,300 | $179,600 | $287,700 |
| 2017 | $6,429 | $453,700 | $171,100 | $282,600 |
| 2016 | $5,662 | $394,300 | $148,700 | $245,600 |
| 2015 | $5,560 | $380,800 | $148,700 | $232,100 |
| 2014 | $4,832 | $325,200 | $148,700 | $176,500 |
Source: Public Records
Map
Nearby Homes
- 347 Centre St
- 21 Totman St Unit 204
- 21 Totman St Unit 306
- 21 Totman St Unit 410
- 21 Totman St Unit 309
- 21 Totman St Unit Model-1
- 21 Totman St Unit 202
- 21 Totman St Unit 2
- 72 Federal Ave
- 203 Centre St
- 192 Federal Ave Unit B
- 195 Independence Ave Unit 137
- 8 Jackson St Unit B2
- 218 Independence Ave Unit B
- 33 Brook Rd
- 64 Garfield St Unit B
- 52 Norman Rd
- 83 Madison Ave
- 21 Arthur St
- 36 Greystone St Unit 36
- 45 Trafford St
- 55 Trafford St
- 55 Trafford St Unit 55
- 55 Trafford St Unit 1
- 43 Trafford St Unit 43
- 43 Trafford St
- 41-43 Trafford St
- 39 Taber St
- 41 Trafford St
- 48 Rodman St
- 53 Taber St
- 50 Trafford St
- 61 Trafford St Unit 3
- 59 Trafford St Unit 1
- 59 Trafford St
- 35 Taber St
- 60 Trafford St Unit 1
- 52 Rodman St
- 65 Trafford St
- 59 Taber St