L
Landlord's Agent in 2019
Lubeck Rausch Team
William Raveis R.E. & Home Services
(781) 631-1199
13 in this area
19 Total Sales

Estimated Value: $727,000 - $776,000
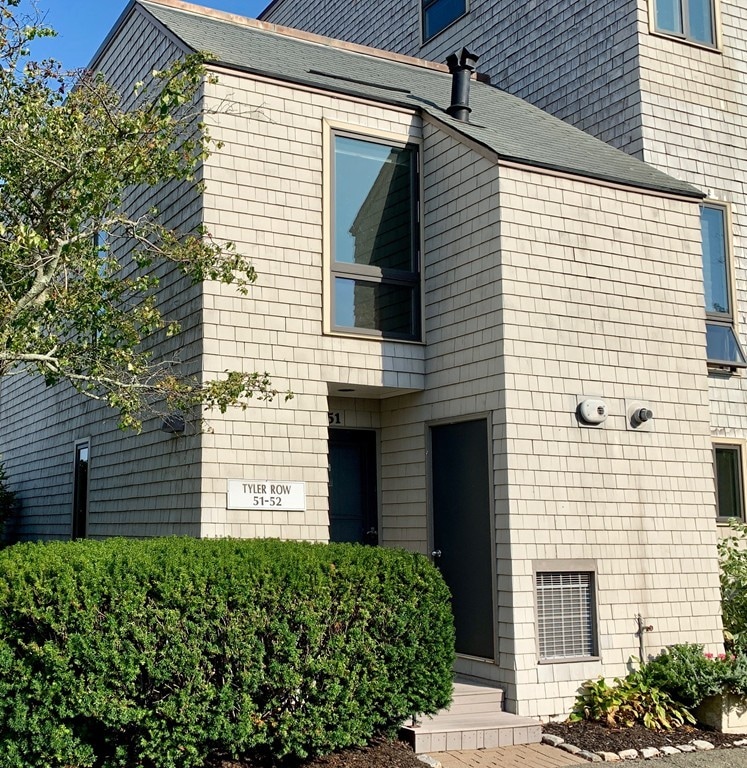
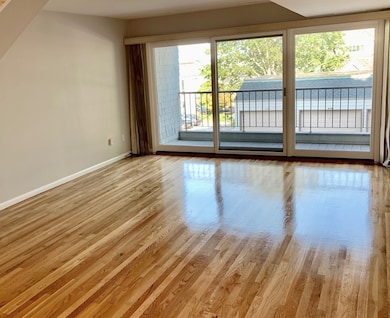
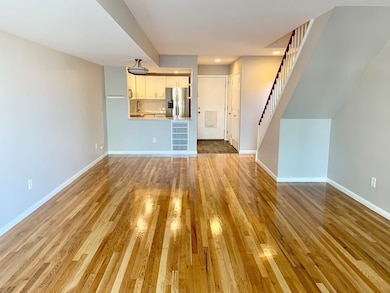
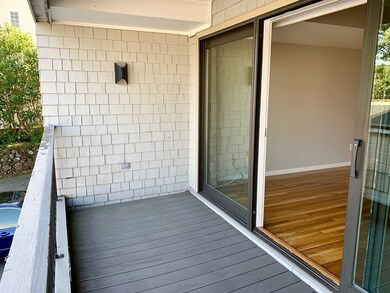
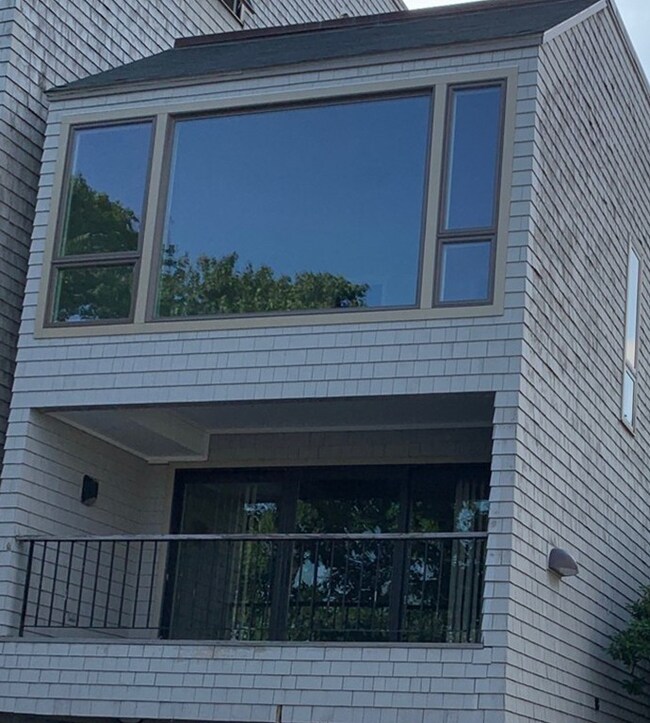
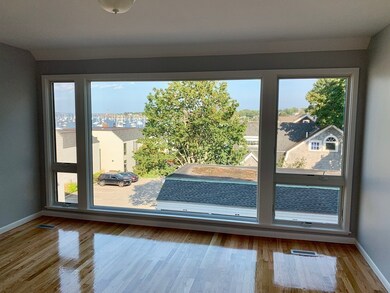
Renovated Glover Landing townhouse with commanding harbor views from the master bedroom. One of only a few unattached townhouses in the complex. Private entrance at ground level with parking right out front. Gleaming hardwood floors, updated bathrooms and freshly painted walls throughout. The renovated kitchen includes quartz countertops and new stainless steel appliances. An open concept living and dining room leads out to a private covered balcony for dining and relaxing while you enjoy the harbor breezes. Wake up every morning to views of Marblehead Light across the harbor from your bedroom. Amenities include a private beach, dock and picnic area on the harbor. Heat and hot water is included in the rent. There is also central air-conditioning and abundant closet space. Don't worry about landscaping, maintenance, snow shoveling or trash removal - it's included! Start living the carefree Glover Landing lifestyle today!
Last Agent to Rent the Property
William Raveis R.E. & Home Services Listed on: 09/13/2019

| Date | Buyer | Sale Price | Title Company |
|---|---|---|---|
| Oconnell Lindsay B | -- | None Available | |
| Coleman Ft | -- | -- | |
| Coleman Richard P | -- | -- |
| Date | Event | Price | List to Sale | Price per Sq Ft |
|---|---|---|---|---|
| 10/15/2019 10/15/19 | Rented | $2,650 | -5.4% | -- |
| 10/15/2019 10/15/19 | Under Contract | -- | -- | -- |
| 09/13/2019 09/13/19 | For Rent | $2,800 | -- | -- |
| Year | Tax Paid | Tax Assessment Tax Assessment Total Assessment is a certain percentage of the fair market value that is determined by local assessors to be the total taxable value of land and additions on the property. | Land | Improvement |
|---|---|---|---|---|
| 2025 | $6,610 | $730,400 | $0 | $730,400 |
| 2024 | $6,191 | $691,000 | $0 | $691,000 |
| 2023 | $6,402 | $640,200 | $0 | $640,200 |
| 2022 | $5,968 | $567,300 | $0 | $567,300 |
| 2021 | $5,499 | $527,700 | $0 | $527,700 |
| 2020 | $5,464 | $525,900 | $0 | $525,900 |
| 2019 | $5,239 | $487,800 | $0 | $487,800 |
| 2018 | $5,336 | $484,200 | $0 | $484,200 |
| 2017 | $4,962 | $450,700 | $0 | $450,700 |
| 2016 | $4,809 | $433,200 | $0 | $433,200 |
| 2015 | $4,491 | $405,300 | $0 | $405,300 |
| 2014 | $4,352 | $392,400 | $0 | $392,400 |
L
Landlord's Agent in 2019
Lubeck Rausch Team
William Raveis R.E. & Home Services
(781) 631-1199
13 in this area
19 Total Sales
Source: MLS Property Information Network (MLS PIN)
MLS Number: 72564836
APN: MARB-000131-000012-000051
Disclaimer: Certain information contained herein is derived from information provided by parties other than Homes.com. All information provided is deemed reliable, but is not guaranteed to be accurate and should be independently verified.
![]() The property listing data and information, or the Images, set forth herein were provided to MLS Property Information Network, Inc. from third party sources, including sellers, lessors and public records, and were compiled by MLS Property Information Network, Inc. The property listing data and information, and the Images, are for the personal, non-commercial use of consumers having a good faith interest in purchasing or leasing listed properties of the type displayed to them and may not be used for any purpose other than to identify prospective properties which such consumers may have a good faith interest in purchasing or leasing. MLS Property Information Network, Inc. and its subscribers disclaim any and all representations and warranties as to the accuracy of the property listing data and information, or as to the accuracy of any of the Images, set forth herein.
The property listing data and information, or the Images, set forth herein were provided to MLS Property Information Network, Inc. from third party sources, including sellers, lessors and public records, and were compiled by MLS Property Information Network, Inc. The property listing data and information, and the Images, are for the personal, non-commercial use of consumers having a good faith interest in purchasing or leasing listed properties of the type displayed to them and may not be used for any purpose other than to identify prospective properties which such consumers may have a good faith interest in purchasing or leasing. MLS Property Information Network, Inc. and its subscribers disclaim any and all representations and warranties as to the accuracy of the property listing data and information, or as to the accuracy of any of the Images, set forth herein.
Ask me questions while you tour the home.