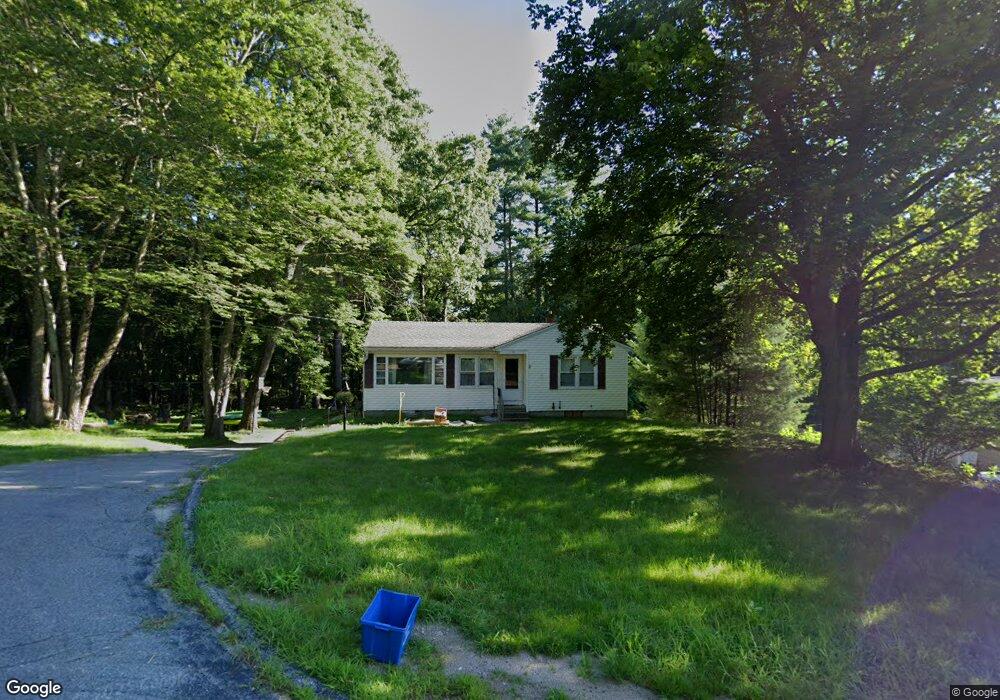
51 Underwood Rd Unit Road Putnam, CT 06260
Estimated Value: $309,000 - $398,000
3
Beds
2
Baths
1,555
Sq Ft
$232/Sq Ft
Est. Value
About This Home
This home is located at 51 Underwood Rd Unit Road, Putnam, CT 06260 and is currently estimated at $361,295, approximately $232 per square foot. 51 Underwood Rd Unit Road is a home located in Windham County with nearby schools including Putnam Elementary School, Putnam Middle School, and Putnam High School.
Ownership History
Date
Name
Owned For
Owner Type
Purchase Details
Closed on
Dec 17, 2009
Sold by
Creme Gregory and Creme Julie
Bought by
Ward Robert J and Ward Amy E
Current Estimated Value
Home Financials for this Owner
Home Financials are based on the most recent Mortgage that was taken out on this home.
Original Mortgage
$193,877
Outstanding Balance
$127,105
Interest Rate
5%
Estimated Equity
$234,190
Purchase Details
Closed on
Jul 13, 2001
Sold by
Joyal Daniel J and Joyal Sandra L
Bought by
Creme Gregory and Creme Julie
Home Financials for this Owner
Home Financials are based on the most recent Mortgage that was taken out on this home.
Original Mortgage
$125,000
Interest Rate
7.2%
Purchase Details
Closed on
Nov 3, 1995
Sold by
Harper Karl D
Bought by
Joyal Daniel J and Joyal Sandra
Home Financials for this Owner
Home Financials are based on the most recent Mortgage that was taken out on this home.
Original Mortgage
$71,640
Interest Rate
7.75%
Mortgage Type
Unknown
Create a Home Valuation Report for This Property
The Home Valuation Report is an in-depth analysis detailing your home's value as well as a comparison with similar homes in the area
Home Values in the Area
Average Home Value in this Area
Purchase History
| Date | Buyer | Sale Price | Title Company |
|---|---|---|---|
| Ward Robert J | $190,000 | -- | |
| Creme Gregory | $125,000 | -- | |
| Joyal Daniel J | $66,500 | -- |
Source: Public Records
Mortgage History
| Date | Status | Borrower | Loan Amount |
|---|---|---|---|
| Open | Joyal Daniel J | $193,877 | |
| Previous Owner | Joyal Daniel J | $125,000 | |
| Previous Owner | Joyal Daniel J | $72,000 | |
| Previous Owner | Joyal Daniel J | $71,640 |
Source: Public Records
Tax History Compared to Growth
Tax History
| Year | Tax Paid | Tax Assessment Tax Assessment Total Assessment is a certain percentage of the fair market value that is determined by local assessors to be the total taxable value of land and additions on the property. | Land | Improvement |
|---|---|---|---|---|
| 2025 | $5,668 | $223,600 | $41,100 | $182,500 |
| 2024 | $7,089 | $213,900 | $41,100 | $172,800 |
| 2023 | $4,552 | $143,200 | $32,700 | $110,500 |
| 2022 | $4,395 | $143,200 | $32,700 | $110,500 |
| 2021 | $1,207 | $143,200 | $32,700 | $110,500 |
| 2020 | $4,273 | $143,200 | $32,700 | $110,500 |
| 2019 | $2,080 | $119,000 | $42,300 | $76,700 |
| 2018 | $3,622 | $119,000 | $42,300 | $76,700 |
| 2017 | $3,499 | $119,000 | $42,300 | $76,700 |
| 2016 | $3,146 | $119,000 | $42,300 | $76,700 |
| 2015 | $3,073 | $119,000 | $42,300 | $76,700 |
| 2014 | $3,082 | $131,300 | $48,000 | $83,300 |
Source: Public Records
Map
Nearby Homes
- 50 Richmond Rd Unit 19
- 257 Sabin St Unit 23
- 224 Pomfret St
- 219 Pomfret St
- 5 Woodstock Hills Dr
- 15 Maynard St
- 109 Battey St
- 16 Wilkinson St
- 252 Church St
- 171 Providence St
- 130 Tripp Rd
- 12 Battey St
- 29 Prospect St Unit A
- 117 Woodside St
- 20 Harrissville Rd
- 6 Harrisville Rd
- 7 Florence St
- 53 Cleveland St
- 115 Grove St
- 26 Barber St Unit 28