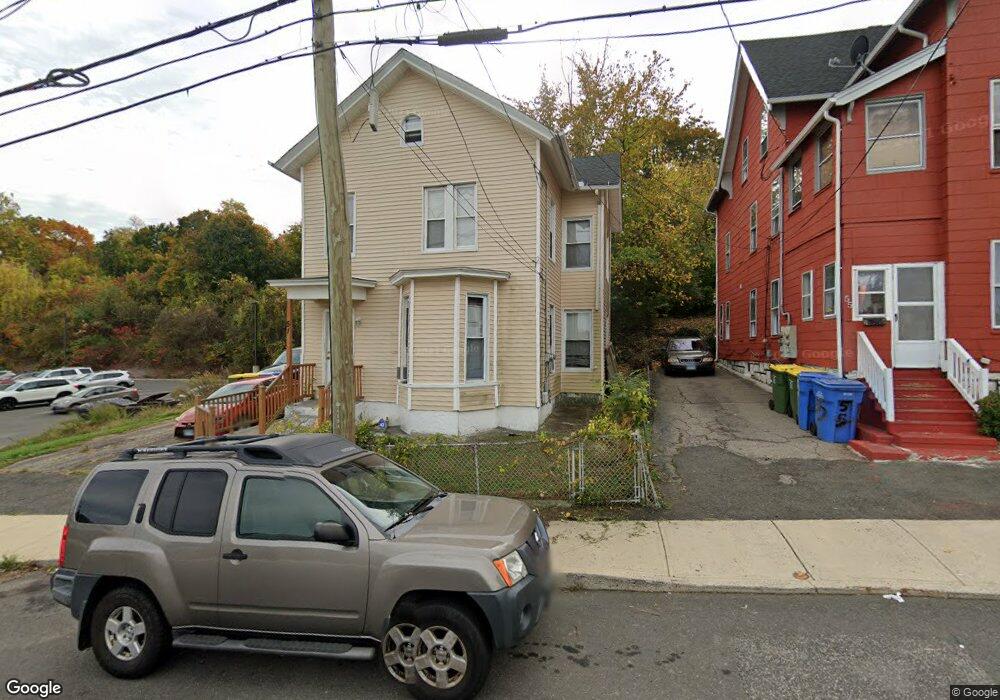
51 W Porter St Waterbury, CT 06708
South End District NeighborhoodEstimated Value: $214,000 - $310,020
4
Beds
2
Baths
1,828
Sq Ft
$140/Sq Ft
Est. Value
About This Home
This home is located at 51 W Porter St, Waterbury, CT 06708 and is currently estimated at $256,255, approximately $140 per square foot. 51 W Porter St is a home located in New Haven County with nearby schools including Duggan School and John F. Kennedy High School.
Ownership History
Date
Name
Owned For
Owner Type
Purchase Details
Closed on
Nov 30, 2023
Sold by
M3 Properties Llc
Bought by
Skyline Homes Llc
Current Estimated Value
Home Financials for this Owner
Home Financials are based on the most recent Mortgage that was taken out on this home.
Original Mortgage
$130,700
Outstanding Balance
$128,367
Interest Rate
7.63%
Mortgage Type
Purchase Money Mortgage
Estimated Equity
$127,888
Purchase Details
Closed on
Apr 8, 2013
Sold by
Marti Dennis
Bought by
M3 Props Llc
Purchase Details
Closed on
Aug 15, 2011
Sold by
Fnma
Bought by
Marti Dev Llc
Purchase Details
Closed on
Apr 5, 2010
Sold by
Bac Home Loans Svcng L
Bought by
Federal National Mortgage Association
Purchase Details
Closed on
Feb 16, 2010
Sold by
Lilly Pamela and Bac Home Loan Svcng Lp
Bought by
Bac Home Loan Svcng Lp
Purchase Details
Closed on
Sep 12, 2005
Sold by
Michael Properties
Bought by
Smith Robert C
Home Financials for this Owner
Home Financials are based on the most recent Mortgage that was taken out on this home.
Original Mortgage
$120,300
Interest Rate
5.79%
Mortgage Type
Purchase Money Mortgage
Purchase Details
Closed on
Nov 2, 2004
Sold by
Union Planters Bk
Bought by
Michael Prop
Create a Home Valuation Report for This Property
The Home Valuation Report is an in-depth analysis detailing your home's value as well as a comparison with similar homes in the area
Home Values in the Area
Average Home Value in this Area
Purchase History
| Date | Buyer | Sale Price | Title Company |
|---|---|---|---|
| Skyline Homes Llc | $170,000 | None Available | |
| M3 Props Llc | $700,000 | -- | |
| Marti Dennis | -- | -- | |
| Marti Dev Llc | $25,900 | -- | |
| Federal National Mortgage Association | -- | -- | |
| Bac Home Loan Svcng Lp | -- | -- | |
| Smith Robert C | $171,900 | -- | |
| Michael Prop | $42,500 | -- |
Source: Public Records
Mortgage History
| Date | Status | Borrower | Loan Amount |
|---|---|---|---|
| Open | Skyline Homes Llc | $130,700 | |
| Previous Owner | Michael Prop | $60,000 | |
| Previous Owner | Michael Prop | $120,300 |
Source: Public Records
Tax History Compared to Growth
Tax History
| Year | Tax Paid | Tax Assessment Tax Assessment Total Assessment is a certain percentage of the fair market value that is determined by local assessors to be the total taxable value of land and additions on the property. | Land | Improvement |
|---|---|---|---|---|
| 2025 | $6,439 | $143,150 | $12,810 | $130,340 |
| 2024 | $7,077 | $143,150 | $12,810 | $130,340 |
| 2023 | $7,757 | $143,150 | $12,810 | $130,340 |
| 2022 | $4,175 | $69,340 | $12,790 | $56,550 |
| 2021 | $4,175 | $69,340 | $12,790 | $56,550 |
| 2020 | $4,175 | $69,340 | $12,790 | $56,550 |
| 2019 | $4,175 | $69,340 | $12,790 | $56,550 |
| 2018 | $4,175 | $69,340 | $12,790 | $56,550 |
| 2017 | $4,844 | $80,460 | $12,780 | $67,680 |
| 2016 | $4,844 | $80,460 | $12,780 | $67,680 |
| 2015 | $4,684 | $80,460 | $12,780 | $67,680 |
| 2014 | $4,684 | $80,460 | $12,780 | $67,680 |
Source: Public Records
Map
Nearby Homes
- 430 Washington Ave
- 318 Congress Ave
- 571 Wilson St
- 21 Poplar St
- 381 Congress Ave
- 36 Norman St
- 70 Vail St
- 16 Clairmont Ave
- 62 Poplar St
- 146 Charles St
- 145 Seymour St
- 576 Highland Ave
- 59 Addison St
- 70 Lawlor St
- 141 Draher St
- 87 Highland Dr
- 137 Greenmount Terrace
- 62 Rosemount Ave
- 15 Tree Hill Rd
- 29 Tree Hill Rd
- 55 W Porter St
- 27 W Porter St
- 27 W Porter St
- 23 W Porter St
- 23 W Porter St
- 23 W Porter St
- 23 & 27 W Porter St
- 23 W Porter St
- 17 W Porter St
- 13 W Porter St
- 257 Congress Ave Unit 2
- 233 Congress Ave
- 241 Congress Ave
- 241 Congress Ave Unit 3rd Floor
- 241 Congress Ave Unit 2nd Floor
- 265 Congress Ave
- 1058 Bank St
- 443 Washington Ave
- 435 Washington Ave