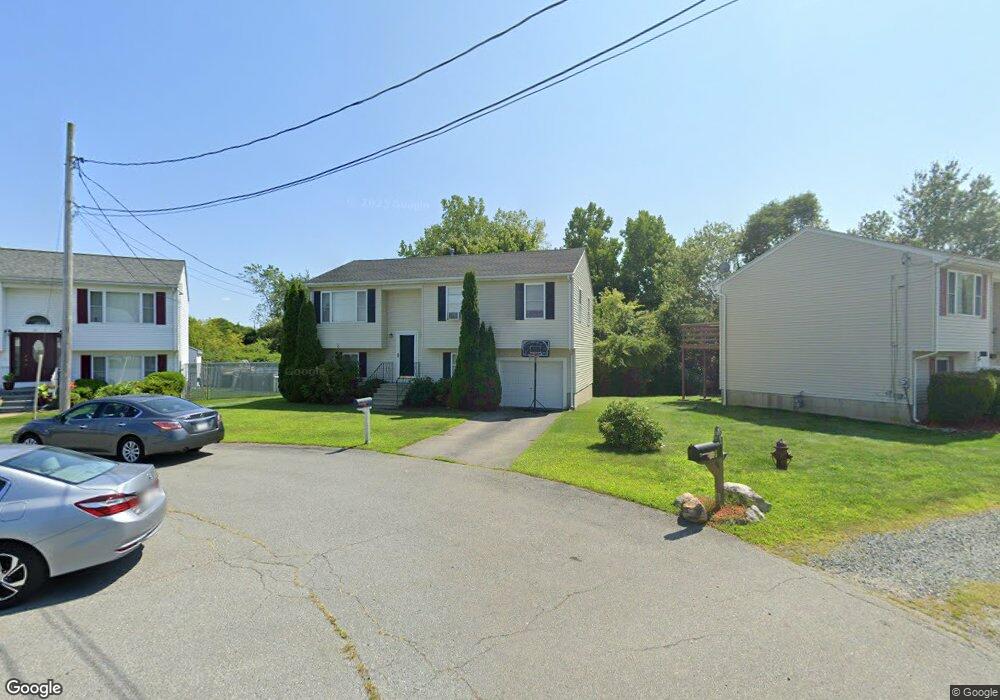
51 Watson Way Fall River, MA 02721
Maplewood NeighborhoodEstimated Value: $466,000 - $496,000
3
Beds
1
Bath
1,652
Sq Ft
$289/Sq Ft
Est. Value
About This Home
This home is located at 51 Watson Way, Fall River, MA 02721 and is currently estimated at $477,731, approximately $289 per square foot. 51 Watson Way is a home located in Bristol County with nearby schools including Henry Lord Community School, B M C Durfee High School, and Argosy Collegiate Charter School.
Ownership History
Date
Name
Owned For
Owner Type
Purchase Details
Closed on
Sep 28, 2001
Sold by
Morrissey Frederick E and Morrissey Patricia B
Bought by
Pelletier David J and Pelletier Marguerite A
Current Estimated Value
Home Financials for this Owner
Home Financials are based on the most recent Mortgage that was taken out on this home.
Original Mortgage
$152,000
Outstanding Balance
$59,585
Interest Rate
6.91%
Mortgage Type
Purchase Money Mortgage
Estimated Equity
$418,146
Purchase Details
Closed on
Nov 27, 1996
Sold by
Well Build Homes Inc
Bought by
Morrissey Frederick E and Morrissey Patricia B
Home Financials for this Owner
Home Financials are based on the most recent Mortgage that was taken out on this home.
Original Mortgage
$87,000
Interest Rate
7.82%
Mortgage Type
Purchase Money Mortgage
Create a Home Valuation Report for This Property
The Home Valuation Report is an in-depth analysis detailing your home's value as well as a comparison with similar homes in the area
Home Values in the Area
Average Home Value in this Area
Purchase History
| Date | Buyer | Sale Price | Title Company |
|---|---|---|---|
| Pelletier David J | $160,000 | -- | |
| Morrissey Frederick E | $112,000 | -- |
Source: Public Records
Mortgage History
| Date | Status | Borrower | Loan Amount |
|---|---|---|---|
| Open | Morrissey Frederick E | $152,000 | |
| Previous Owner | Morrissey Frederick E | $92,000 | |
| Previous Owner | Morrissey Frederick E | $87,000 |
Source: Public Records
Tax History Compared to Growth
Tax History
| Year | Tax Paid | Tax Assessment Tax Assessment Total Assessment is a certain percentage of the fair market value that is determined by local assessors to be the total taxable value of land and additions on the property. | Land | Improvement |
|---|---|---|---|---|
| 2025 | $4,711 | $411,400 | $117,300 | $294,100 |
| 2024 | $4,220 | $367,300 | $115,000 | $252,300 |
| 2023 | $4,121 | $335,900 | $103,600 | $232,300 |
| 2022 | $3,604 | $285,600 | $97,700 | $187,900 |
| 2021 | $3,523 | $254,700 | $93,400 | $161,300 |
| 2020 | $3,426 | $237,100 | $89,100 | $148,000 |
| 2019 | $3,515 | $241,100 | $93,100 | $148,000 |
| 2018 | $2,927 | $200,200 | $93,800 | $106,400 |
| 2017 | $2,748 | $196,300 | $93,800 | $102,500 |
| 2016 | $2,546 | $186,800 | $96,700 | $90,100 |
| 2015 | $2,473 | $189,100 | $96,700 | $92,400 |
| 2014 | $2,379 | $189,100 | $96,700 | $92,400 |
Source: Public Records
Map
Nearby Homes