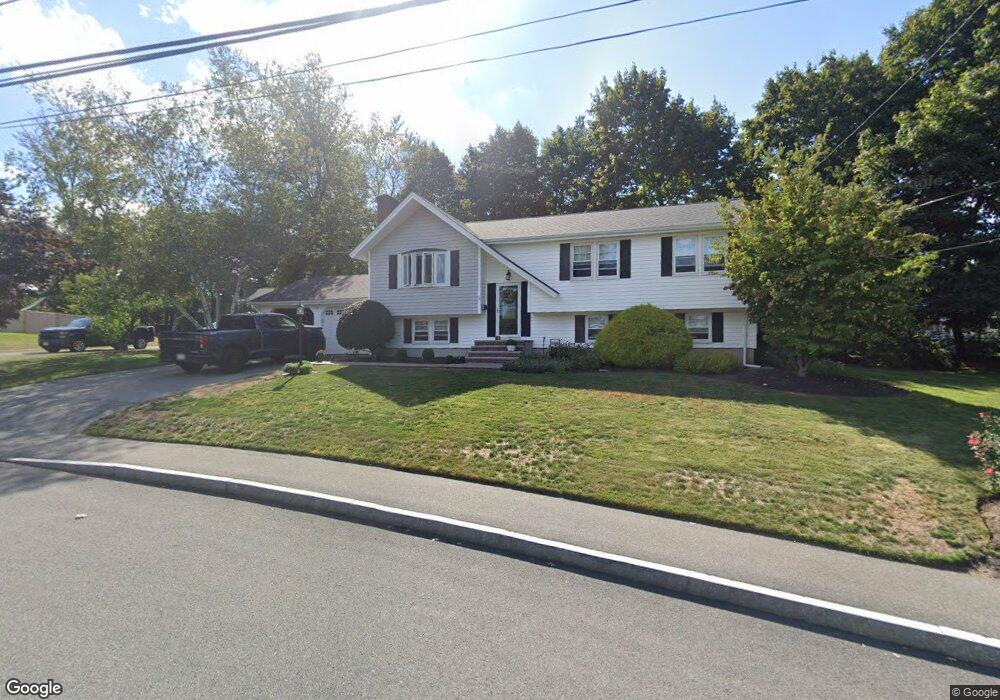
51 Windsor Rd South Weymouth, MA 02190
South Weymouth NeighborhoodEstimated Value: $637,092 - $802,000
2
Beds
2
Baths
1,184
Sq Ft
$600/Sq Ft
Est. Value
About This Home
This home is located at 51 Windsor Rd, South Weymouth, MA 02190 and is currently estimated at $710,023, approximately $599 per square foot. 51 Windsor Rd is a home located in Norfolk County with nearby schools including Thomas V Nash, Abigail Adams Middle School, and Weymouth Middle School Chapman.
Ownership History
Date
Name
Owned For
Owner Type
Purchase Details
Closed on
May 30, 1996
Sold by
Mcdavitt Gail C
Bought by
Deane Karen P and Deane Joseph T
Current Estimated Value
Home Financials for this Owner
Home Financials are based on the most recent Mortgage that was taken out on this home.
Original Mortgage
$130,000
Interest Rate
7.91%
Mortgage Type
Purchase Money Mortgage
Create a Home Valuation Report for This Property
The Home Valuation Report is an in-depth analysis detailing your home's value as well as a comparison with similar homes in the area
Home Values in the Area
Average Home Value in this Area
Purchase History
| Date | Buyer | Sale Price | Title Company |
|---|---|---|---|
| Deane Karen P | $190,000 | -- |
Source: Public Records
Mortgage History
| Date | Status | Borrower | Loan Amount |
|---|---|---|---|
| Open | Deane Karen P | $123,500 | |
| Closed | Deane Karen P | $130,000 |
Source: Public Records
Tax History Compared to Growth
Tax History
| Year | Tax Paid | Tax Assessment Tax Assessment Total Assessment is a certain percentage of the fair market value that is determined by local assessors to be the total taxable value of land and additions on the property. | Land | Improvement |
|---|---|---|---|---|
| 2025 | $6,001 | $594,200 | $236,700 | $357,500 |
| 2024 | $5,926 | $577,000 | $225,400 | $351,600 |
| 2023 | $5,586 | $534,500 | $208,700 | $325,800 |
| 2022 | $5,438 | $474,500 | $193,300 | $281,200 |
| 2021 | $5,238 | $446,200 | $193,300 | $252,900 |
| 2020 | $5,073 | $425,600 | $193,300 | $232,300 |
| 2019 | $4,987 | $411,500 | $185,900 | $225,600 |
| 2018 | $5,029 | $402,300 | $193,100 | $209,200 |
| 2017 | $4,928 | $384,700 | $183,900 | $200,800 |
| 2016 | $4,485 | $350,400 | $176,800 | $173,600 |
| 2015 | $4,390 | $340,300 | $176,800 | $163,500 |
| 2014 | $4,273 | $321,300 | $164,600 | $156,700 |
Source: Public Records
Map
Nearby Homes
- 200 Justin Dr Unit 3
- 116 Belmont St
- 2 Tara Dr Unit 1
- 255 West St
- 262 West St
- 655 Summer St
- 2 Mitchell Ln Unit B
- 92 Mercury St
- 501 Commerce Dr Unit 2310
- 501 Commerce Dr Unit 1111
- 501 Commerce Dr Unit 4206
- 501 Commerce Dr Unit 4308
- 501 Commerce Dr Unit 4306
- 747 Middle St
- 27 Park Ave
- 200 Burkhall St Unit 803
- 200 Burkhall St Unit 102
- 215 Winter St Unit 1P
- 191 Tall Oaks Dr Unit C
- 308 Forest St