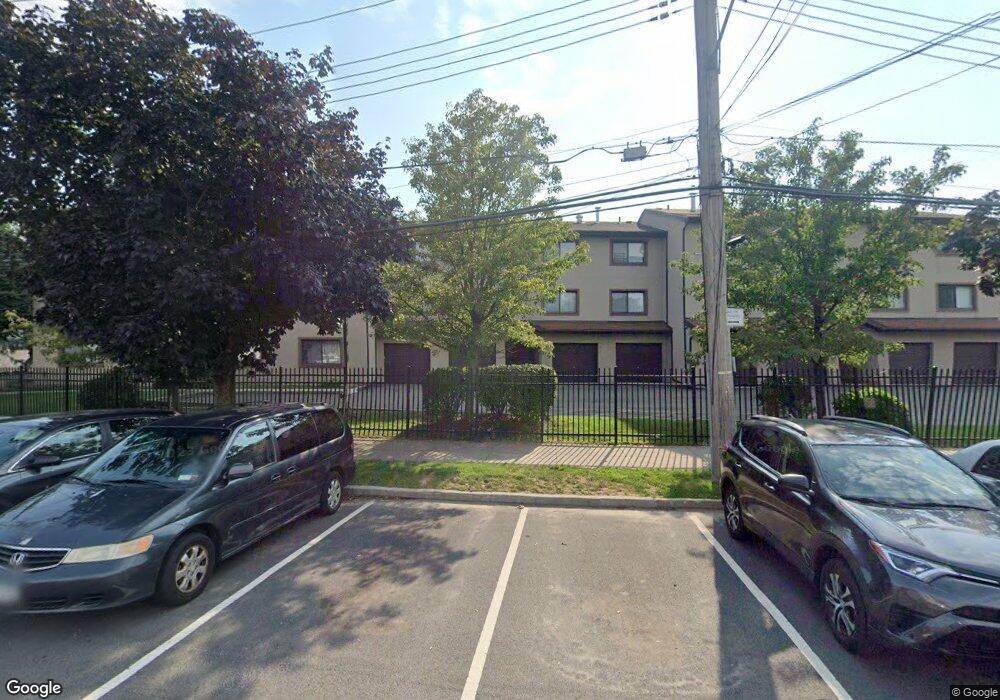
510 115th St Unit D College Point, NY 11356
College Point NeighborhoodEstimated Value: $588,000 - $659,000
--
Bed
--
Bath
917
Sq Ft
$678/Sq Ft
Est. Value
About This Home
This home is located at 510 115th St Unit D, College Point, NY 11356 and is currently estimated at $622,184, approximately $678 per square foot. 510 115th St Unit D is a home located in Queens County with nearby schools including P.S. 129 Patricia Larkin, J.H.S. 194 William Carr, and Flushing High School.
Ownership History
Date
Name
Owned For
Owner Type
Purchase Details
Closed on
Feb 25, 2022
Sold by
Epstein Emma F
Bought by
Li Yuxin and Shao Shuai
Current Estimated Value
Home Financials for this Owner
Home Financials are based on the most recent Mortgage that was taken out on this home.
Original Mortgage
$459,375
Outstanding Balance
$428,077
Interest Rate
3.69%
Mortgage Type
Purchase Money Mortgage
Estimated Equity
$194,107
Purchase Details
Closed on
Jun 3, 2020
Sold by
Epsteiin John A
Bought by
Epstein Emma F and Epstein John A
Purchase Details
Closed on
Jan 4, 1996
Sold by
Edelman Norman and Finkelstein Paul
Bought by
Epstein John A
Home Financials for this Owner
Home Financials are based on the most recent Mortgage that was taken out on this home.
Original Mortgage
$106,400
Interest Rate
7.04%
Mortgage Type
Purchase Money Mortgage
Create a Home Valuation Report for This Property
The Home Valuation Report is an in-depth analysis detailing your home's value as well as a comparison with similar homes in the area
Home Values in the Area
Average Home Value in this Area
Purchase History
| Date | Buyer | Sale Price | Title Company |
|---|---|---|---|
| Li Yuxin | $612,500 | -- | |
| Epstein Emma F | -- | -- | |
| Epstein John A | $112,000 | First American Title Ins Co |
Source: Public Records
Mortgage History
| Date | Status | Borrower | Loan Amount |
|---|---|---|---|
| Open | Li Yuxin | $459,375 | |
| Previous Owner | Epstein John A | $106,400 |
Source: Public Records
Tax History Compared to Growth
Tax History
| Year | Tax Paid | Tax Assessment Tax Assessment Total Assessment is a certain percentage of the fair market value that is determined by local assessors to be the total taxable value of land and additions on the property. | Land | Improvement |
|---|---|---|---|---|
| 2025 | $3,410 | $17,110 | $1,568 | $15,542 |
| 2024 | $3,410 | $16,979 | $1,521 | $15,458 |
| 2023 | $3,217 | $16,019 | $1,579 | $14,440 |
| 2022 | $3,017 | $24,512 | $2,591 | $21,921 |
| 2021 | $2,705 | $23,133 | $2,591 | $20,542 |
| 2020 | $2,722 | $22,313 | $2,591 | $19,722 |
| 2019 | $2,667 | $21,523 | $2,591 | $18,932 |
| 2018 | $2,424 | $13,349 | $1,519 | $11,830 |
| 2017 | $2,268 | $12,594 | $1,463 | $11,131 |
| 2016 | $2,065 | $12,594 | $1,463 | $11,131 |
| 2015 | $1,213 | $11,882 | $1,915 | $9,967 |
| 2014 | $1,213 | $11,792 | $1,900 | $9,892 |
Source: Public Records
Map
Nearby Homes
- 512 115th St Unit 512D
- 5-24 115th St Unit 524C
- 11516 Poppenhusen Ave
- 5-41 117th St
- 5-39 117th St
- 114-67 Taipei Ct
- 5-03 119th St
- 114-03 Dalian Ct
- 10-41 115th St
- 11949 6th Ave
- 119-20 9th Ave
- 120-13 9th Ave
- 121-16 8th Ave
- 12-25 119th St
- 11701 14th Ave
- 337 Park Crescent
- 12141 6th Ave
- 325 Park Crescent
- 7-06 College Point Blvd
- 11516 14th Ave
- 510 115th St Unit 510F
- 510 115th St Unit 510E
- 510 115th St Unit 510D
- 510 115th St Unit 510C
- 510 115th St Unit 510A
- 5-10 115th St Unit A
- 5-10 115th St Unit 1st Fl
- 5-10 115th St Unit D
- 510 115th St Unit F
- 510 115th St Unit E
- 510 115th St Unit C
- 510 115th St Unit A
- 510 115th St Unit F
- 5-10 115th St Unit C
- 5-10 115th St Unit F
- 512 115th St Unit 512F
- 512 115th St Unit 512E
- 512 115th St Unit 512C
- 512 115th St Unit 512B
- 512 115th St Unit 512A