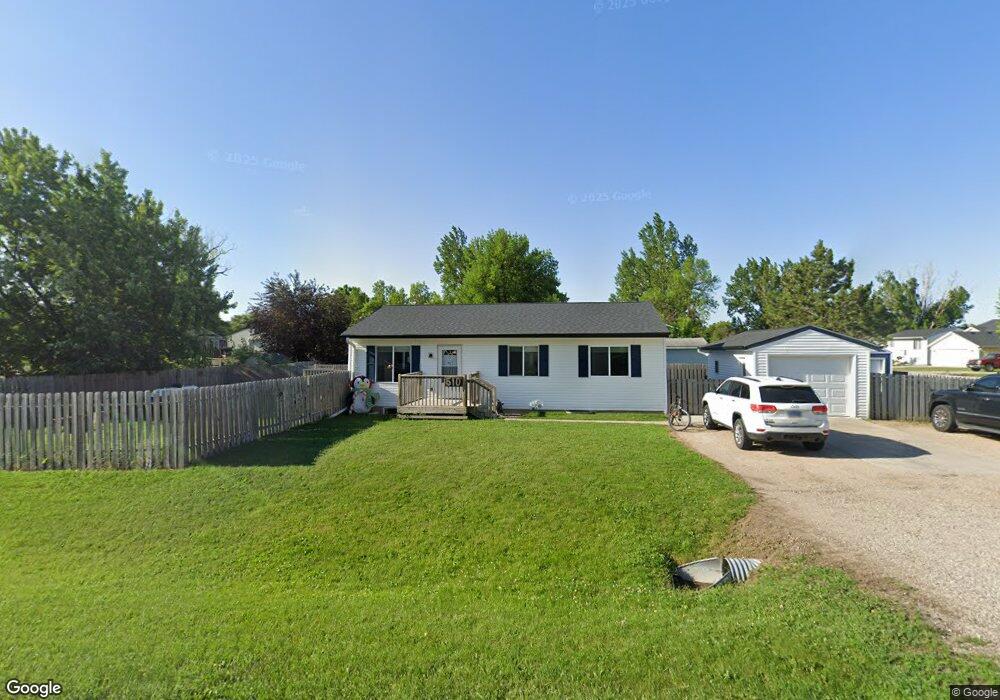
510 5th St Mapleton, ND 58059
Estimated Value: $236,000 - $324,000
5
Beds
2
Baths
980
Sq Ft
$267/Sq Ft
Est. Value
About This Home
This home is located at 510 5th St, Mapleton, ND 58059 and is currently estimated at $261,514, approximately $266 per square foot. 510 5th St is a home located in Cass County with nearby schools including Mapleton Elementary School.
Ownership History
Date
Name
Owned For
Owner Type
Purchase Details
Closed on
Oct 7, 2016
Sold by
Ladouceur Jarred
Bought by
Reid Michael W
Current Estimated Value
Home Financials for this Owner
Home Financials are based on the most recent Mortgage that was taken out on this home.
Original Mortgage
$171,717
Outstanding Balance
$137,532
Interest Rate
3.43%
Mortgage Type
New Conventional
Estimated Equity
$123,982
Purchase Details
Closed on
Jul 24, 2012
Sold by
Jh & Jh Properties Llc
Bought by
Ladouceur Jarred
Home Financials for this Owner
Home Financials are based on the most recent Mortgage that was taken out on this home.
Original Mortgage
$119,790
Interest Rate
3.25%
Mortgage Type
FHA
Purchase Details
Closed on
Nov 28, 2011
Sold by
Beyer Mark P
Bought by
Jh & Jh Properties Llc
Home Financials for this Owner
Home Financials are based on the most recent Mortgage that was taken out on this home.
Original Mortgage
$89,000
Interest Rate
4.12%
Mortgage Type
Future Advance Clause Open End Mortgage
Create a Home Valuation Report for This Property
The Home Valuation Report is an in-depth analysis detailing your home's value as well as a comparison with similar homes in the area
Purchase History
| Date | Buyer | Sale Price | Title Company |
|---|---|---|---|
| Reid Michael W | $170,000 | None Available | |
| Ladouceur Jarred | $122,000 | Title Co | |
| Jh & Jh Properties Llc | $43,000 | Valley Title & Escrow |
Source: Public Records
Mortgage History
| Date | Status | Borrower | Loan Amount |
|---|---|---|---|
| Open | Reid Michael W | $171,717 | |
| Previous Owner | Ladouceur Jarred | $119,790 | |
| Previous Owner | Jh & Jh Properties Llc | $89,000 |
Source: Public Records
Tax History
| Year | Tax Paid | Tax Assessment Tax Assessment Total Assessment is a certain percentage of the fair market value that is determined by local assessors to be the total taxable value of land and additions on the property. | Land | Improvement |
|---|---|---|---|---|
| 2024 | $2,998 | $96,500 | $16,150 | $80,350 |
| 2023 | $2,953 | $96,700 | $16,150 | $80,550 |
| 2022 | $2,569 | $88,800 | $16,150 | $72,650 |
| 2021 | $2,424 | $80,350 | $12,500 | $67,850 |
| 2020 | $2,315 | $78,050 | $12,500 | $65,550 |
| 2019 | $2,296 | $78,050 | $12,500 | $65,550 |
| 2018 | $2,319 | $78,050 | $12,500 | $65,550 |
| 2017 | $2,180 | $77,300 | $12,500 | $64,800 |
| 2016 | $1,179 | $59,600 | $7,150 | $52,450 |
| 2015 | $1,036 | $55,150 | $6,600 | $48,550 |
| 2014 | $1,012 | $50,150 | $6,000 | $44,150 |
| 2013 | $1,028 | $50,150 | $6,000 | $44,150 |
Source: Public Records
Map
Nearby Homes
Your Personal Tour Guide
Ask me questions while you tour the home.