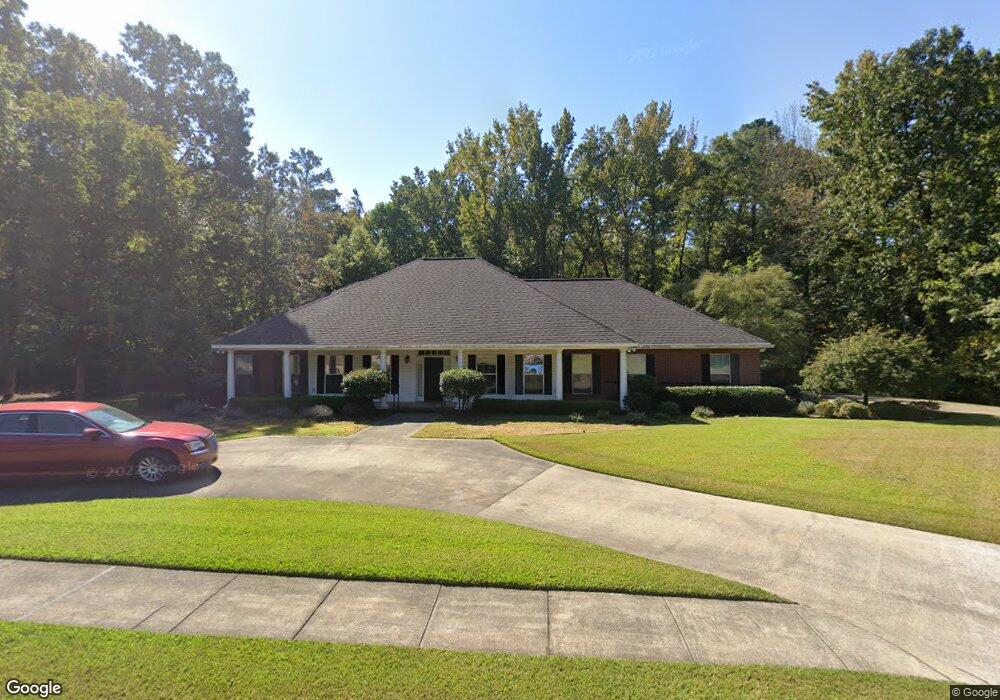
510 Audubon Dr Ruston, LA 71270
Estimated Value: $498,000 - $608,000
3
Beds
3
Baths
4,275
Sq Ft
$126/Sq Ft
Est. Value
About This Home
This home is located at 510 Audubon Dr, Ruston, LA 71270 and is currently estimated at $537,313, approximately $125 per square foot. 510 Audubon Dr is a home located in Lincoln Parish with nearby schools including Hillcrest Elementary School, Ruston Elementary School, and Ruston Junior High School.
Ownership History
Date
Name
Owned For
Owner Type
Purchase Details
Closed on
Aug 31, 2011
Sold by
Broadway Roderick C
Bought by
White Allen L
Current Estimated Value
Home Financials for this Owner
Home Financials are based on the most recent Mortgage that was taken out on this home.
Original Mortgage
$276,000
Outstanding Balance
$191,867
Interest Rate
4.58%
Mortgage Type
New Conventional
Estimated Equity
$345,446
Purchase Details
Closed on
Feb 22, 2010
Sold by
Moseley Patterson W
Bought by
Broadway Roderick
Home Financials for this Owner
Home Financials are based on the most recent Mortgage that was taken out on this home.
Original Mortgage
$330,125
Interest Rate
5.11%
Mortgage Type
New Conventional
Purchase Details
Closed on
Jul 28, 2008
Sold by
Moseley Patterson B and Moseley Jean W
Bought by
Moseley Patterson W and The Patterson B Moseley Trust
Create a Home Valuation Report for This Property
The Home Valuation Report is an in-depth analysis detailing your home's value as well as a comparison with similar homes in the area
Home Values in the Area
Average Home Value in this Area
Purchase History
| Date | Buyer | Sale Price | Title Company |
|---|---|---|---|
| White Allen L | $345,000 | None Available | |
| Broadway Roderick | -- | None Available | |
| Moseley Patterson W | -- | None Available |
Source: Public Records
Mortgage History
| Date | Status | Borrower | Loan Amount |
|---|---|---|---|
| Open | White Allen L | $276,000 | |
| Previous Owner | Broadway Roderick | $330,125 |
Source: Public Records
Tax History Compared to Growth
Tax History
| Year | Tax Paid | Tax Assessment Tax Assessment Total Assessment is a certain percentage of the fair market value that is determined by local assessors to be the total taxable value of land and additions on the property. | Land | Improvement |
|---|---|---|---|---|
| 2024 | $3,898 | $45,670 | $7,475 | $38,195 |
| 2023 | $3,385 | $38,092 | $4,550 | $33,542 |
| 2022 | $3,402 | $38,092 | $4,550 | $33,542 |
| 2021 | $3,149 | $38,092 | $4,550 | $33,542 |
| 2020 | $3,166 | $38,092 | $4,550 | $33,542 |
| 2019 | $3,185 | $39,222 | $4,550 | $34,672 |
| 2018 | $3,099 | $39,222 | $4,550 | $34,672 |
| 2017 | $3,106 | $39,222 | $4,550 | $34,672 |
| 2016 | $3,094 | $0 | $0 | $0 |
| 2015 | $3,116 | $36,279 | $3,850 | $32,429 |
| 2013 | $3,165 | $36,279 | $3,850 | $32,429 |
Source: Public Records
Map
Nearby Homes
- 521 Audubon Dr
- 297 Jefferson Oaks Dr
- Lot 5 Llangeler Dr
- Kavanaugh Rd
- 2158 Llangeler Dr
- 901 Pennington Ln
- 600 Jefferson Ave
- 3001 Belcara Dr
- 402 E Kentucky Ave
- 2408 Rhody Dr
- 503 E Kentucky Ave
- 2201 Cooktown Rd
- 203 Huey Ave
- 704 Hundred Oaks Dr
- 509 E Kentucky Ave
- 904 Sherwood Dr
- 512 Glendale Dr
- 1715 N Trenton St
- 1607 N Trenton St
- 2203 Greenbriar Dr
- 520 Audubon Dr
- 511 Audubon Dr
- 501 Audubon Dr
- 204 W Woodhaven Rd
- 530 Audubon Dr
- 302 W Woodhaven Rd
- 213 Audubon Dr
- 201 Audubon Trail
- 500 Audubon Dr
- 431 Audubon Dr
- 000 Audubon Dr
- 438 Audubon Dr
- 540 Audubon Dr
- 200 E Woodhaven Rd
- 209 W Woodhaven Rd
- 223 Audubon Dr
- 421 Audubon Dr
- 308 W Woodhaven Rd
- 210 Audubon Dr
- 301 W Woodhaven Rd