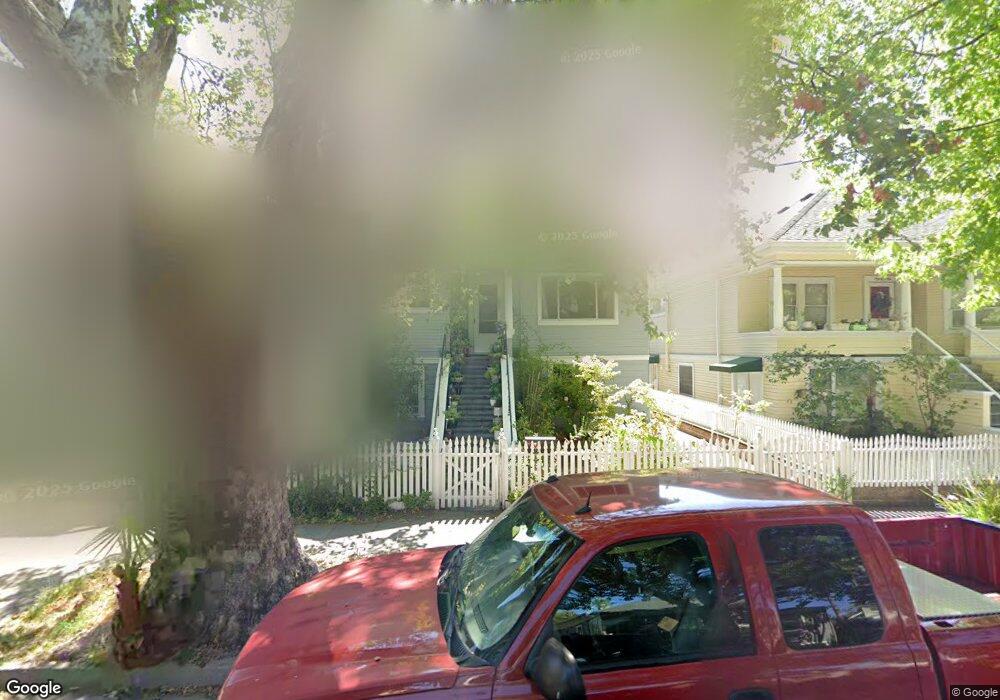
510 C St San Rafael, CA 94901
Gerstle Park NeighborhoodEstimated Value: $1,108,000 - $1,475,000
4
Beds
2
Baths
2,144
Sq Ft
$607/Sq Ft
Est. Value
About This Home
This home is located at 510 C St, San Rafael, CA 94901 and is currently estimated at $1,300,868, approximately $606 per square foot. 510 C St is a home located in Marin County with nearby schools including Laurel Dell Elementary School, James B. Davidson Middle School, and San Rafael High School.
Ownership History
Date
Name
Owned For
Owner Type
Purchase Details
Closed on
Jun 8, 2021
Sold by
Moore David and Orourke Kelley
Bought by
Moore David and Orourke Kelley S
Current Estimated Value
Home Financials for this Owner
Home Financials are based on the most recent Mortgage that was taken out on this home.
Original Mortgage
$502,000
Interest Rate
2.88%
Mortgage Type
New Conventional
Purchase Details
Closed on
May 15, 2021
Sold by
Moore David and Orourke Kelley
Bought by
Moore David and Orourke Kelley
Home Financials for this Owner
Home Financials are based on the most recent Mortgage that was taken out on this home.
Original Mortgage
$502,000
Interest Rate
2.88%
Mortgage Type
New Conventional
Purchase Details
Closed on
Jun 3, 2008
Sold by
Velasquez Aracely O
Bought by
Moore David and Orourke Kelley
Home Financials for this Owner
Home Financials are based on the most recent Mortgage that was taken out on this home.
Original Mortgage
$565,000
Interest Rate
6.5%
Mortgage Type
Purchase Money Mortgage
Purchase Details
Closed on
May 1, 2006
Sold by
Gilliland Lyman C and Gilliland Gladys C
Bought by
Velasquez Aracely O
Home Financials for this Owner
Home Financials are based on the most recent Mortgage that was taken out on this home.
Original Mortgage
$570,500
Interest Rate
6.29%
Mortgage Type
Stand Alone First
Purchase Details
Closed on
Mar 4, 1997
Sold by
Gilliland Lyman C and Gilliland Gladys C
Bought by
Gilliland Lyman C and Gilliland Gladys C
Purchase Details
Closed on
Sep 1, 1994
Sold by
Englebright Catherine and Kacharos Stephen
Bought by
Gilliland Lyman C and Gilliland Gladys C
Home Financials for this Owner
Home Financials are based on the most recent Mortgage that was taken out on this home.
Original Mortgage
$225,000
Interest Rate
8.57%
Purchase Details
Closed on
Jul 7, 1994
Sold by
Englebright Catherine
Bought by
Englebright Catherine and Kacharos Stephen
Home Financials for this Owner
Home Financials are based on the most recent Mortgage that was taken out on this home.
Original Mortgage
$225,000
Interest Rate
8.57%
Create a Home Valuation Report for This Property
The Home Valuation Report is an in-depth analysis detailing your home's value as well as a comparison with similar homes in the area
Home Values in the Area
Average Home Value in this Area
Purchase History
We collect this data history from publicly available records. To have your information removed, we recommend requesting removal directly through your county’s website.
| Date | Buyer | Sale Price | Title Company |
|---|---|---|---|
| Moore David | -- | None Available | |
| Moore David | $620,000 | Amrock | |
| Moore David | $710,000 | First American Title Company | |
| Velasquez Aracely O | $815,000 | Old Republic Title Company | |
| Gilliland Lyman C | -- | -- | |
| Gilliland Lyman C | $320,000 | First American Title Company | |
| Englebright Catherine | -- | -- |
Source: Public Records
Mortgage History
We collect this data history from publicly available records. To have your information removed, we recommend requesting removal directly through your county’s website.
| Date | Status | Borrower | Loan Amount |
|---|---|---|---|
| Previous Owner | Moore David | $502,000 | |
| Previous Owner | Moore David | $565,000 | |
| Previous Owner | Velasquez Aracely O | $570,500 | |
| Previous Owner | Gilliland Lyman C | $225,000 |
Source: Public Records
Tax History
| Year | Tax Paid | Tax Assessment Tax Assessment Total Assessment is a certain percentage of the fair market value that is determined by local assessors to be the total taxable value of land and additions on the property. | Land | Improvement |
|---|---|---|---|---|
| 2025 | $19,098 | $1,279,233 | $680,206 | $599,027 |
| 2024 | $18,238 | $1,244,157 | $666,873 | $577,284 |
| 2023 | $16,194 | $1,082,510 | $653,799 | $428,711 |
| 2022 | $15,351 | $1,061,285 | $640,980 | $420,305 |
| 2021 | $12,871 | $855,467 | $546,043 | $309,424 |
| 2020 | $12,748 | $846,697 | $540,445 | $306,252 |
| 2019 | $12,301 | $830,101 | $529,852 | $300,249 |
| 2018 | $12,187 | $813,830 | $519,466 | $294,364 |
| 2017 | $11,759 | $797,876 | $509,283 | $288,593 |
| 2016 | $11,373 | $782,232 | $499,297 | $282,935 |
| 2015 | $10,872 | $770,486 | $491,800 | $278,686 |
| 2014 | $10,394 | $755,399 | $482,170 | $273,229 |
Source: Public Records
Map
Nearby Homes
- 226 Bayview St
- 46 Martens Blvd
- 31 Martens Blvd
- 11 San Rafael Ave
- 135 Martens Blvd
- 59, 60 Clayton St
- 21 Woods St
- 39 Latham St
- 1547 4th St Unit A
- 111 C St
- 12 Estates Ct
- 183 Reservoir Rd
- 823 Mission Ave
- 820 Mission Ave Unit 4
- 820 Mission Ave Unit 7
- 215 Bungalow Ave
- 51 El Camino Ave
- 351 G St
- 180 El Cerrito Ave
- 1836 5th Ave
Your Personal Tour Guide
Ask me questions while you tour the home.