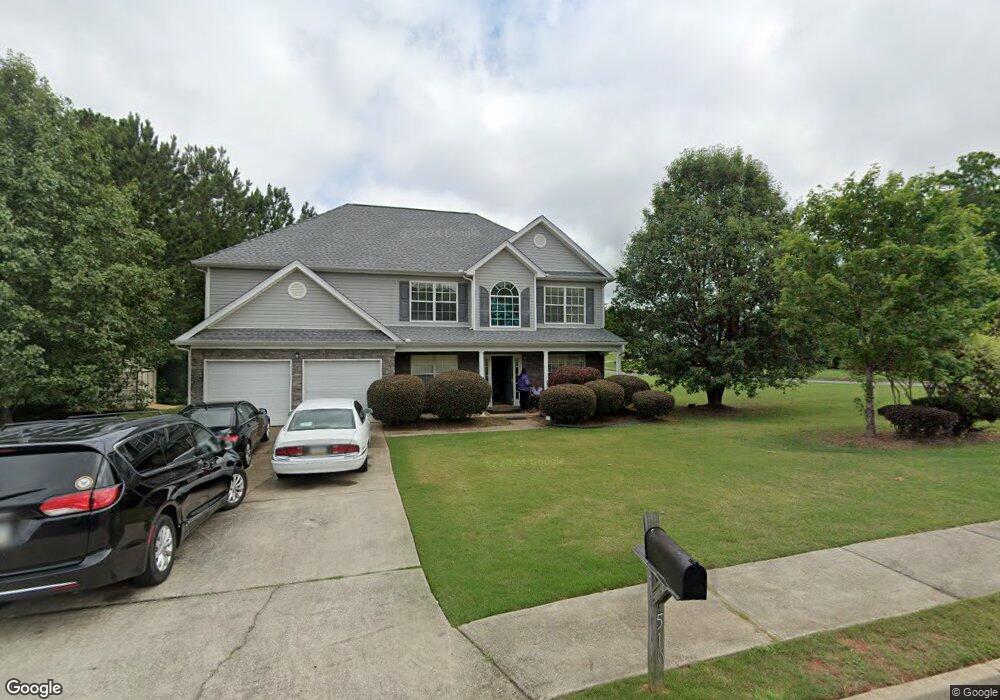
510 Canady Ct Unit 1 Hampton, GA 30228
Estimated Value: $302,953 - $346,000
4
Beds
3
Baths
2,700
Sq Ft
$122/Sq Ft
Est. Value
About This Home
This home is located at 510 Canady Ct Unit 1, Hampton, GA 30228 and is currently estimated at $330,488, approximately $122 per square foot. 510 Canady Ct Unit 1 is a home located in Clayton County with nearby schools including River's Edge Elementary School, Eddie White Academy, and Lovejoy High School.
Ownership History
Date
Name
Owned For
Owner Type
Purchase Details
Closed on
Jul 13, 2021
Sold by
Ingram Terrance L
Bought by
Ingram Angelia E
Current Estimated Value
Purchase Details
Closed on
Feb 15, 2011
Sold by
Ingram Angelia E
Bought by
Ingram Angelia E and Ingram Terrance L
Home Financials for this Owner
Home Financials are based on the most recent Mortgage that was taken out on this home.
Original Mortgage
$97,465
Interest Rate
5.25%
Mortgage Type
FHA
Purchase Details
Closed on
Aug 19, 2003
Sold by
Northbridge Homes Llc
Bought by
Dennis Robin R and Dennis Victor
Home Financials for this Owner
Home Financials are based on the most recent Mortgage that was taken out on this home.
Original Mortgage
$167,722
Interest Rate
6.32%
Mortgage Type
FHA
Create a Home Valuation Report for This Property
The Home Valuation Report is an in-depth analysis detailing your home's value as well as a comparison with similar homes in the area
Home Values in the Area
Average Home Value in this Area
Purchase History
| Date | Buyer | Sale Price | Title Company |
|---|---|---|---|
| Ingram Angelia E | -- | -- | |
| Ingram Angelia E | -- | -- | |
| Ingram Angelia E | $100,000 | -- | |
| Dennis Robin R | $170,400 | -- |
Source: Public Records
Mortgage History
| Date | Status | Borrower | Loan Amount |
|---|---|---|---|
| Previous Owner | Ingram Angelia E | $97,465 | |
| Previous Owner | Dennis Robin R | $167,722 |
Source: Public Records
Tax History Compared to Growth
Tax History
| Year | Tax Paid | Tax Assessment Tax Assessment Total Assessment is a certain percentage of the fair market value that is determined by local assessors to be the total taxable value of land and additions on the property. | Land | Improvement |
|---|---|---|---|---|
| 2024 | $4,638 | $127,720 | $10,400 | $117,320 |
| 2023 | $4,611 | $127,720 | $10,400 | $117,320 |
| 2022 | $3,436 | $96,400 | $10,400 | $86,000 |
| 2021 | $2,659 | $76,160 | $10,400 | $65,760 |
| 2020 | $2,606 | $74,024 | $10,400 | $63,624 |
| 2019 | $2,553 | $71,778 | $9,600 | $62,178 |
| 2018 | $2,459 | $69,452 | $9,600 | $59,852 |
| 2017 | $2,497 | $70,258 | $9,600 | $60,658 |
| 2016 | $2,413 | $68,172 | $9,600 | $58,572 |
| 2015 | $1,392 | $0 | $0 | $0 |
| 2014 | $1,037 | $34,919 | $9,600 | $25,319 |
Source: Public Records
Map
Nearby Homes
- 12148 Flannery Ln
- 12275 Styron Dr
- 472 Andrews Dr
- 12283 Coldstream Ct
- 11961 Markham Way
- 12216 Edgewater Dr
- 12328 Edgewater Dr
- 0 Panhandle Rd Unit 7648796
- 0 Panhandle Rd Unit LOT 1 10559919
- 0 Panhandle Rd Unit LOT 4 10559933
- 0 Panhandle Rd Unit 10603376
- 0 Panhandle Rd Unit LOT 3 10559926
- 0 Panhandle Rd Unit LOT 2 10559924
- 12402 Muir Field Ct
- 12350 Riviera Dr
- 11800 Guelph Cir
- LOT #1 S Hampton Annex
- 442 Toronto Cir
- 12075 Haley Ln
- 536 Caledon Way
- 498 Canady Ct
- 244 Kimberwick Dr Unit 2
- 12571 Canady Dr Unit 1
- 256 Kimberwick Dr
- 228 Kimberwick Dr Unit 2
- 526 Canady Ct
- 486 Canady Ct Unit 1
- 12572 Bailey Ct Unit 12
- 12572 Bailey Ct Unit 1
- 525 Canady Ct
- 264 Kimberwick Dr Unit 2
- 12583 Canady Dr Unit 1
- 12583 Canady Dr
- 216 Kimberwick Dr
- 243 Kimberwick Dr
- 243 Kimberwick Dr Unit /84
- 474 Canady Ct
- 537 Canady Ct Unit 1
- 229 Kimberwick Dr
- 276 Kimberwick Dr