Estimated Value: $100,274 - $132,000
--
Bed
1
Bath
1,062
Sq Ft
$111/Sq Ft
Est. Value
About This Home
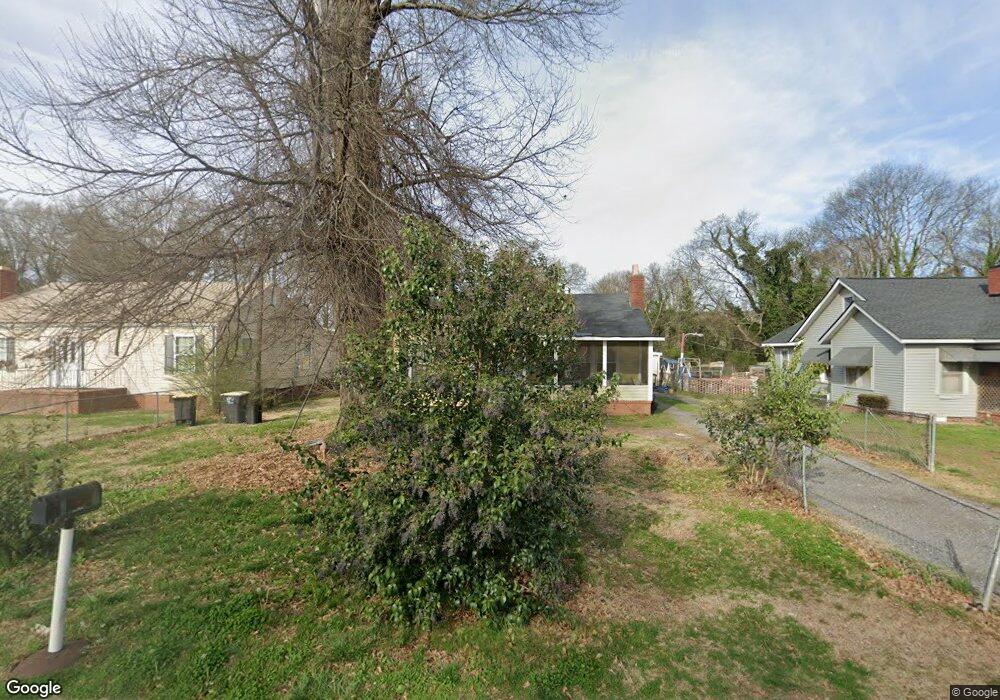
This home is located at 510 Cedar Ave SW, Rome, GA 30161 and is currently estimated at $118,319, approximately $111 per square foot. 510 Cedar Ave SW is a home located in Floyd County with nearby schools including Dan McCarty Middle School, Rome High School, and Darlington School.
Ownership History
Date
Name
Owned For
Owner Type
Purchase Details
Closed on
Dec 30, 2021
Sold by
Evans Donald L
Bought by
D & L Evans Family Limited Partners
Current Estimated Value
Purchase Details
Closed on
Sep 8, 2009
Sold by
Coots Rl
Bought by
Evans Donald L
Purchase Details
Closed on
Jun 15, 2009
Sold by
Coots R L
Bought by
Coots R L
Purchase Details
Closed on
Jun 1, 2009
Sold by
American Pinnacle Inc
Bought by
Coots R L
Purchase Details
Closed on
May 17, 2004
Sold by
Coots R L
Bought by
American Pinnacle Inc
Purchase Details
Closed on
May 17, 1994
Sold by
Brock Cynthia Renee Edwards
Bought by
Coots R L
Purchase Details
Closed on
Mar 5, 1985
Sold by
Brock Helen Christine
Bought by
Brock Darrell Sullivan
Purchase Details
Closed on
Mar 20, 1978
Sold by
Darrell Sullivan Brock
Bought by
Brock Helen Christine
Purchase Details
Closed on
Jan 1, 1901
Bought by
Brock Donald C
Create a Home Valuation Report for This Property
The Home Valuation Report is an in-depth analysis detailing your home's value as well as a comparison with similar homes in the area
Home Values in the Area
Average Home Value in this Area
Purchase History
| Date | Buyer | Sale Price | Title Company |
|---|---|---|---|
| D & L Evans Family Limited Partners | -- | -- | |
| D & L Evans Family Limited Partnership | -- | -- | |
| Evans Donald L | $50,000 | -- | |
| Coots R L | -- | -- | |
| Coots R L | $49,857 | -- | |
| Coots R L | -- | -- | |
| American Pinnacle Inc | $61,000 | -- | |
| Coots R L | $23,000 | -- | |
| Brock Cynthia Renee Edwards | -- | -- | |
| Brock Darrell Sullivan | -- | -- | |
| Brock Helen Christine | -- | -- | |
| Brock Donald C | -- | -- |
Source: Public Records
Tax History Compared to Growth
Tax History
| Year | Tax Paid | Tax Assessment Tax Assessment Total Assessment is a certain percentage of the fair market value that is determined by local assessors to be the total taxable value of land and additions on the property. | Land | Improvement |
|---|---|---|---|---|
| 2024 | $1,479 | $33,395 | $3,713 | $29,682 |
| 2023 | $1,183 | $31,594 | $3,182 | $28,412 |
| 2022 | $960 | $26,317 | $2,652 | $23,665 |
| 2021 | $830 | $22,374 | $2,652 | $19,722 |
| 2020 | $775 | $20,718 | $2,122 | $18,596 |
| 2019 | $724 | $19,571 | $2,122 | $17,449 |
| 2018 | $683 | $18,444 | $2,122 | $16,322 |
| 2017 | $658 | $17,760 | $2,122 | $15,638 |
| 2016 | $640 | $17,240 | $2,120 | $15,120 |
| 2015 | $605 | $17,240 | $2,120 | $15,120 |
| 2014 | $605 | $17,240 | $2,120 | $15,120 |
Source: Public Records
Map
Nearby Homes
- 1901 Hull Ave SW
- 304 E 19th St SW
- 000 E Oglethorpe Hwy
- 2014 Maple Ave SW
- 39 E 16th St SW
- 106 E 14th St SW
- 14 Clover St SW
- 2108 Maple Ave SW
- 1705 Olmstead St SW
- 1502 Spring Creek St SW
- 316 S McLin St SW
- 0 Martha Berry Hwy Unit 7525627
- 0 Martha Berry Hwy Unit 7614774
- 0 Martha Berry Hwy Unit 10563404
- 4 E 15th St SW
- 414 E 17th St SW
- 111 Hosea St SW
- 164 E 11th St SE
- 168 E 11th St SE
- 170 E 11th St SW
- 512 Cedar Ave SW
- 508 Cedar Ave SW
- 506 Cedar Ave SW
- 0 Cedar Ave SW Unit 3158505
- 0 Cedar Ave SW Unit 8690031
- 0 Cedar Ave SW Unit 8224420
- 0 Cedar Ave SW Unit 7458302
- 0 Cedar Ave SW Unit 7052124
- 0 Cedar Ave SW Unit 3175179
- 0 Cedar Ave SW Unit 7434397
- 0 Cedar Ave SW Unit 7280159
- 0 Cedar Ave SW Unit 7378927
- 0 Cedar Ave SW Unit 8525217
- 0 Cedar Ave SW Unit 9026146
- 0 Cedar Ave SW Unit 8116503
- 511 Cedar Ave SW Unit Land
- 511 Cedar Ave SW
- 504 Cedar Ave SW
- 509 Cedar Ave SW
- 509 Cedar Ave SW