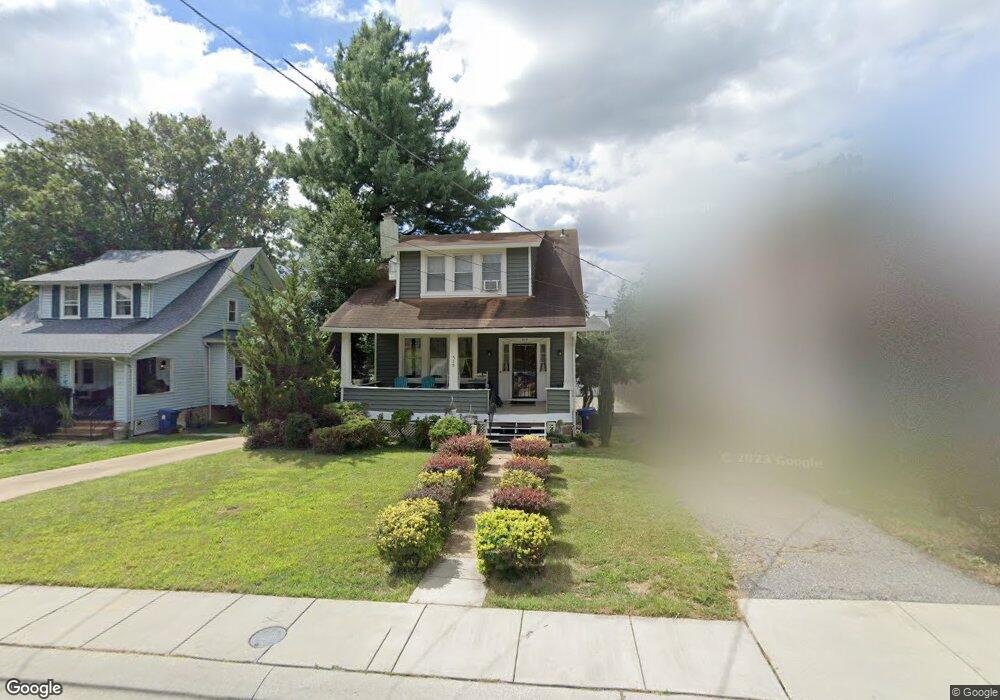
510 Charing Cross Rd Baltimore, MD 21229
Estimated Value: $346,000 - $356,099
3
Beds
2
Baths
1,252
Sq Ft
$282/Sq Ft
Est. Value
About This Home
This home is located at 510 Charing Cross Rd, Baltimore, MD 21229 and is currently estimated at $353,025, approximately $281 per square foot. 510 Charing Cross Rd is a home located in Baltimore County with nearby schools including Thomas Jefferson Elementary School, Booker T. Washington Middle School, and Edmondson Westside High School.
Ownership History
Date
Name
Owned For
Owner Type
Purchase Details
Closed on
Jun 16, 2008
Sold by
Irani Daraius
Bought by
Gerstenberg Megan and Kline Joshua
Current Estimated Value
Home Financials for this Owner
Home Financials are based on the most recent Mortgage that was taken out on this home.
Original Mortgage
$257,962
Outstanding Balance
$164,345
Interest Rate
5.91%
Mortgage Type
Purchase Money Mortgage
Estimated Equity
$188,680
Purchase Details
Closed on
Apr 30, 2008
Sold by
Irani Daraius
Bought by
Gerstenberg Megan and Kline Joshua
Home Financials for this Owner
Home Financials are based on the most recent Mortgage that was taken out on this home.
Original Mortgage
$257,962
Outstanding Balance
$164,345
Interest Rate
5.91%
Mortgage Type
Purchase Money Mortgage
Estimated Equity
$188,680
Purchase Details
Closed on
Aug 20, 1998
Sold by
Nodar Mary C
Bought by
Irani Daraius and Irani Catalina
Purchase Details
Closed on
Mar 18, 1982
Sold by
Hugus Frank R
Bought by
Nodar Mary C
Create a Home Valuation Report for This Property
The Home Valuation Report is an in-depth analysis detailing your home's value as well as a comparison with similar homes in the area
Home Values in the Area
Average Home Value in this Area
Purchase History
| Date | Buyer | Sale Price | Title Company |
|---|---|---|---|
| Gerstenberg Megan | $260,000 | -- | |
| Gerstenberg Megan | $260,000 | -- | |
| Irani Daraius | $120,000 | -- | |
| Nodar Mary C | $55,000 | -- |
Source: Public Records
Mortgage History
| Date | Status | Borrower | Loan Amount |
|---|---|---|---|
| Open | Gerstenberg Megan | $257,962 | |
| Previous Owner | Gerstenberg Megan | $257,962 |
Source: Public Records
Tax History Compared to Growth
Tax History
| Year | Tax Paid | Tax Assessment Tax Assessment Total Assessment is a certain percentage of the fair market value that is determined by local assessors to be the total taxable value of land and additions on the property. | Land | Improvement |
|---|---|---|---|---|
| 2025 | $3,680 | $280,700 | -- | -- |
| 2024 | $3,680 | $262,300 | $82,400 | $179,900 |
| 2023 | $1,713 | $250,000 | $0 | $0 |
| 2022 | $3,264 | $237,700 | $0 | $0 |
| 2021 | $3,194 | $225,400 | $82,400 | $143,000 |
| 2020 | $3,194 | $223,100 | $0 | $0 |
| 2019 | $3,129 | $220,800 | $0 | $0 |
| 2018 | $3,003 | $218,500 | $77,400 | $141,100 |
| 2017 | $2,867 | $207,767 | $0 | $0 |
| 2016 | $2,987 | $197,033 | $0 | $0 |
| 2015 | $2,987 | $186,300 | $0 | $0 |
| 2014 | $2,987 | $186,300 | $0 | $0 |
Source: Public Records
Map
Nearby Homes
- 5201 Old Frederick Rd
- 5301 Edmondson Ave
- 603 Stamford Rd
- 5402 Edmondson Ave
- 5124 Edmondson Ave
- 617 North Bend
- 408 N Rock Glen Rd
- 205 Westowne Rd
- 5408 Addington Rd
- 5310 Brabant Rd
- 720 N Chapel Gate Ln
- 5100 Brook Green Rd
- 5427 Channing Rd
- 10 Mardrew Rd
- 813 Wedgewood Rd
- 1201 Saint Agnes Ln
- 511 N Chapel Gate Ln
- 5466 Addington Rd
- 961 Saint Agnes Ln
- 905 Cooks Ln
- 510 Charing Cross Rd
- 508 Charing Cross Rd
- 512 Charing Cross Rd
- 511 Charing Cross Rd
- 514 Charing Cross Rd
- 511H Charing Cross Rd
- 506 Charing Cross Rd
- 513 Charing Cross Rd
- 509 Charing Cross Rd
- 504 Charing Cross Rd
- 516 Charing Cross Rd
- 518 Charing Cross Rd
- 507 Charing Cross Rd
- 515 Charing Cross Rd
- 520 Charing Cross Rd
- 522 Charing Cross Rd
- 524 Charing Cross Rd
- 5203 Garmouth Rd
- 625 Braeside Rd
- 627 Braeside Rd