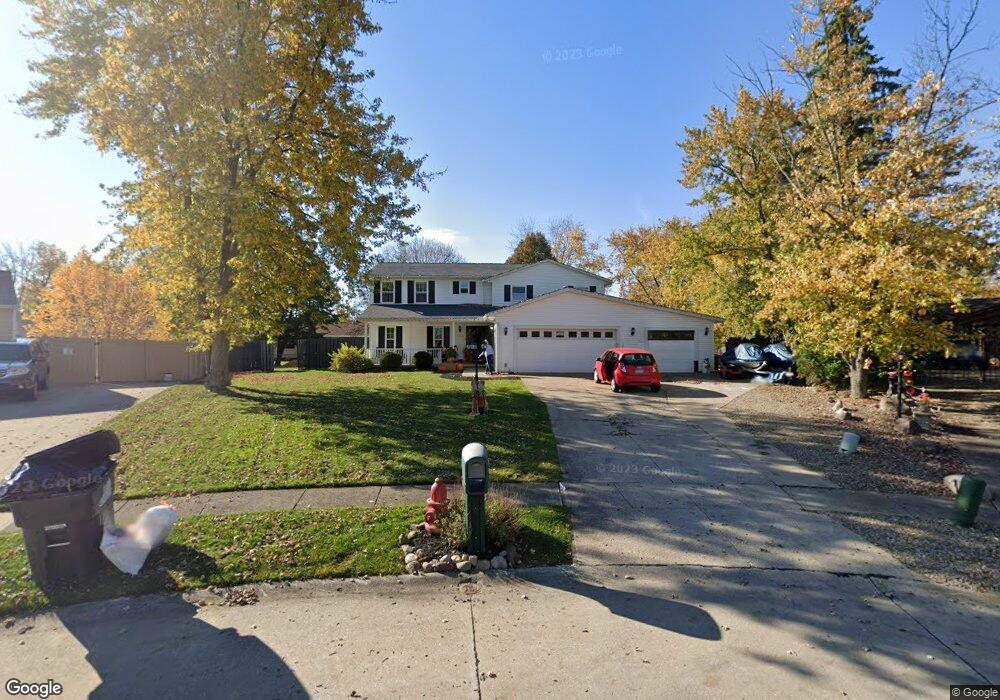
510 Cranlyn Ct Brunswick, OH 44212
Estimated Value: $327,000 - $357,000
4
Beds
2
Baths
1,948
Sq Ft
$178/Sq Ft
Est. Value
About This Home
This home is located at 510 Cranlyn Ct, Brunswick, OH 44212 and is currently estimated at $346,370, approximately $177 per square foot. 510 Cranlyn Ct is a home located in Medina County with nearby schools including Brunswick Memorial Elementary School, Willets Middle School, and Brunswick High School.
Ownership History
Date
Name
Owned For
Owner Type
Purchase Details
Closed on
Dec 3, 2003
Sold by
Chapman Jesse E
Bought by
Creswell Christopher C and Creswell Amy J
Current Estimated Value
Home Financials for this Owner
Home Financials are based on the most recent Mortgage that was taken out on this home.
Original Mortgage
$155,000
Outstanding Balance
$81,945
Interest Rate
7.94%
Mortgage Type
Purchase Money Mortgage
Estimated Equity
$264,425
Purchase Details
Closed on
Feb 6, 2003
Sold by
Chapman Jesse E and Chapman Susan E
Bought by
Chapman Jesse E
Purchase Details
Closed on
Mar 16, 2000
Sold by
Lebold Daniel C and Lebold Pamela L
Bought by
Chapman Jesse E
Home Financials for this Owner
Home Financials are based on the most recent Mortgage that was taken out on this home.
Original Mortgage
$126,000
Interest Rate
8.39%
Create a Home Valuation Report for This Property
The Home Valuation Report is an in-depth analysis detailing your home's value as well as a comparison with similar homes in the area
Home Values in the Area
Average Home Value in this Area
Purchase History
| Date | Buyer | Sale Price | Title Company |
|---|---|---|---|
| Creswell Christopher C | $155,000 | Premier Title Agency | |
| Chapman Jesse E | -- | Kaspar & Associates Inc | |
| Chapman Jesse E | $140,000 | Prospect Title Agency Inc |
Source: Public Records
Mortgage History
| Date | Status | Borrower | Loan Amount |
|---|---|---|---|
| Open | Creswell Christopher C | $155,000 | |
| Closed | Chapman Jesse E | $126,000 |
Source: Public Records
Tax History Compared to Growth
Tax History
| Year | Tax Paid | Tax Assessment Tax Assessment Total Assessment is a certain percentage of the fair market value that is determined by local assessors to be the total taxable value of land and additions on the property. | Land | Improvement |
|---|---|---|---|---|
| 2024 | $4,848 | $91,100 | $22,930 | $68,170 |
| 2023 | $4,848 | $91,100 | $22,930 | $68,170 |
| 2022 | $4,643 | $91,100 | $22,930 | $68,170 |
| 2021 | $3,772 | $72,300 | $18,200 | $54,100 |
| 2020 | $3,956 | $72,300 | $18,200 | $54,100 |
| 2019 | $4,321 | $72,300 | $18,200 | $54,100 |
| 2018 | $3,285 | $60,610 | $16,540 | $44,070 |
| 2017 | $3,954 | $60,610 | $16,540 | $44,070 |
| 2016 | $3,701 | $60,610 | $16,540 | $44,070 |
| 2015 | $3,613 | $55,100 | $15,040 | $40,060 |
| 2014 | $3,606 | $55,100 | $15,040 | $40,060 |
| 2013 | $3,544 | $55,100 | $15,040 | $40,060 |
Source: Public Records
Map
Nearby Homes
- 3776 Claridge Oval
- 683 East Dr
- 458 Mohawk Trail
- 338 Delaware Dr
- 291 Crestway Oval
- 356 Lakewood Ave
- 4139 Beverly Hills Dr
- 196 Pinnacle Dr
- 399 Judita Dr
- 159 Sunflower Dr
- 4223 Bennington Blvd
- 3495 Grafton Rd
- 3991 Buckingham Dr
- 3976 Buckingham Dr
- 647 Pearl Rd
- 4259 Pelham Way
- 858 Quinebaug Ct
- 4431 Oak Ridge Trail
- 4332 Oak Ridge Trail
- 97 Weathervane Ln
- 502 Cranlyn Ct
- 509 Cranlyn Ct
- 3891 Grafton Rd
- 3899 Grafton Rd
- 3877 Grafton Rd
- 496 Cranlyn Ct
- 3907 Grafton Rd
- 501 Cranlyn Ct
- 3869 Grafton Rd
- 488 Cranlyn Ct
- 495 Cranlyn Ct
- 3915 Grafton Rd
- 3902 Landon Ln
- 3861 Grafton Rd
- 3874 Landon Ln
- 480 Cranlyn Ct
- 3886 Grafton Rd
- 3894 Grafton Rd
- 3880 Grafton Rd
- 3868 Landon Ln