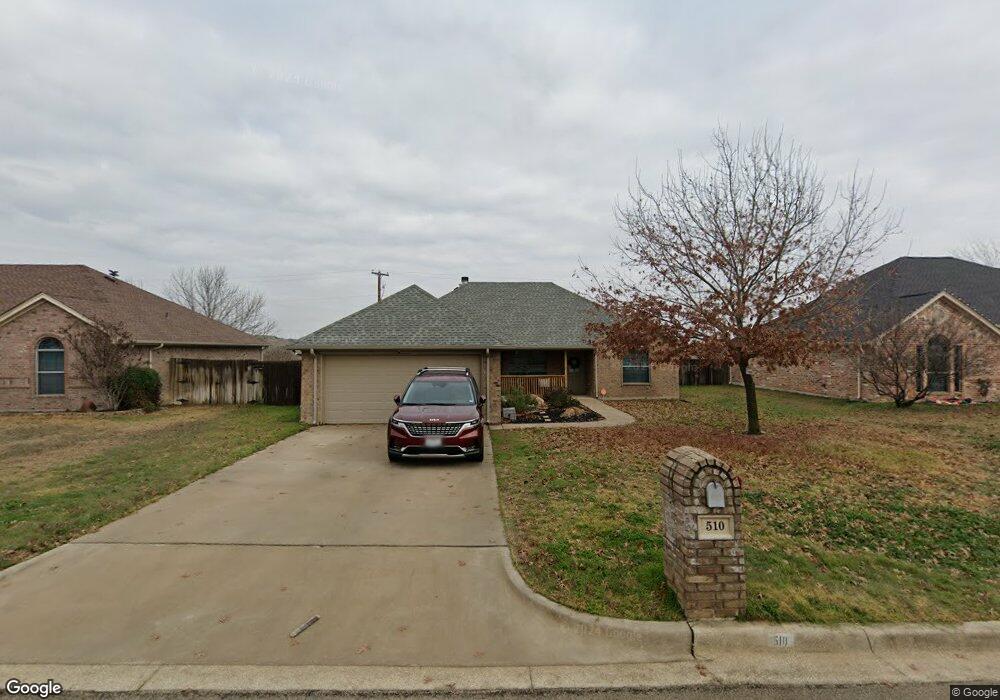
510 Crow Ave Weatherford, TX 76085
Estimated Value: $269,894 - $292,000
--
Bed
--
Bath
1,342
Sq Ft
$212/Sq Ft
Est. Value
About This Home
This home is located at 510 Crow Ave, Weatherford, TX 76085 and is currently estimated at $284,724, approximately $212 per square foot. 510 Crow Ave is a home located in Parker County with nearby schools including Crockett Elementary School, Tison Middle School, and Weatherford High School.
Ownership History
Date
Name
Owned For
Owner Type
Purchase Details
Closed on
Dec 23, 2020
Sold by
Bond Carrie Lee
Bought by
Moss Jonah L and Moss Madison L
Current Estimated Value
Home Financials for this Owner
Home Financials are based on the most recent Mortgage that was taken out on this home.
Original Mortgage
$170,000
Outstanding Balance
$151,621
Interest Rate
2.8%
Mortgage Type
New Conventional
Estimated Equity
$133,103
Purchase Details
Closed on
Jan 18, 2017
Sold by
Gaff Casey Leigh and Hood Casey Leigh
Bought by
Wright Janet L
Purchase Details
Closed on
Jul 18, 2006
Sold by
New Robert
Bought by
Wright Janet L
Home Financials for this Owner
Home Financials are based on the most recent Mortgage that was taken out on this home.
Original Mortgage
$119,554
Interest Rate
6.62%
Mortgage Type
FHA
Purchase Details
Closed on
Apr 18, 2006
Sold by
Saglio Partnership Ltd
Bought by
Wright Janet L
Purchase Details
Closed on
Apr 17, 2003
Bought by
Wright Janet L
Create a Home Valuation Report for This Property
The Home Valuation Report is an in-depth analysis detailing your home's value as well as a comparison with similar homes in the area
Home Values in the Area
Average Home Value in this Area
Purchase History
| Date | Buyer | Sale Price | Title Company |
|---|---|---|---|
| Moss Jonah L | -- | Providence Title Company | |
| Wright Janet L | -- | Providence Title Company | |
| Wright Janet L | -- | -- | |
| Goff Casey Leigh | -- | Stnt | |
| Wright Janet L | -- | -- | |
| Wright Janet L | -- | -- |
Source: Public Records
Mortgage History
| Date | Status | Borrower | Loan Amount |
|---|---|---|---|
| Open | Moss Jonah L | $170,000 | |
| Previous Owner | Goff Casey Leigh | $119,554 |
Source: Public Records
Tax History Compared to Growth
Tax History
| Year | Tax Paid | Tax Assessment Tax Assessment Total Assessment is a certain percentage of the fair market value that is determined by local assessors to be the total taxable value of land and additions on the property. | Land | Improvement |
|---|---|---|---|---|
| 2025 | $3,452 | $256,133 | -- | -- |
| 2024 | $3,452 | $232,848 | -- | -- |
| 2023 | $3,452 | $290,870 | $40,000 | $250,870 |
| 2022 | $4,269 | $192,440 | $20,000 | $172,440 |
| 2021 | $4,621 | $192,440 | $20,000 | $172,440 |
| 2020 | $4,058 | $167,940 | $20,000 | $147,940 |
| 2019 | $3,925 | $167,940 | $20,000 | $147,940 |
| 2018 | $3,584 | $139,730 | $20,000 | $119,730 |
| 2017 | $3,492 | $139,730 | $20,000 | $119,730 |
| 2016 | $3,174 | $120,640 | $20,000 | $100,640 |
| 2015 | $2,731 | $120,640 | $20,000 | $100,640 |
| 2014 | $2,537 | $109,380 | $20,000 | $89,380 |
Source: Public Records
Map
Nearby Homes
- 522 Crow Ave
- 509 Sweetwater Dr
- 1609 Dicey Rd
- 110 Pine St
- 214 Cedar St
- Horseshoe Bend Rd
- 0 Adell Cir
- 249 Wandering Ln
- 101 Meadow Ct
- 107 Hickory Ln
- 228 Allen St
- The Chisholm Plan at Hickory Place Addition
- 305 Hickory Ln
- Lot 14 Clover Cir
- 307 Hickory Ln
- Lot 15 Clover Cir
- 905 Terry Trail
- 213 S Line St
- 1003 E Columbia St
- 309 De la Cruz St