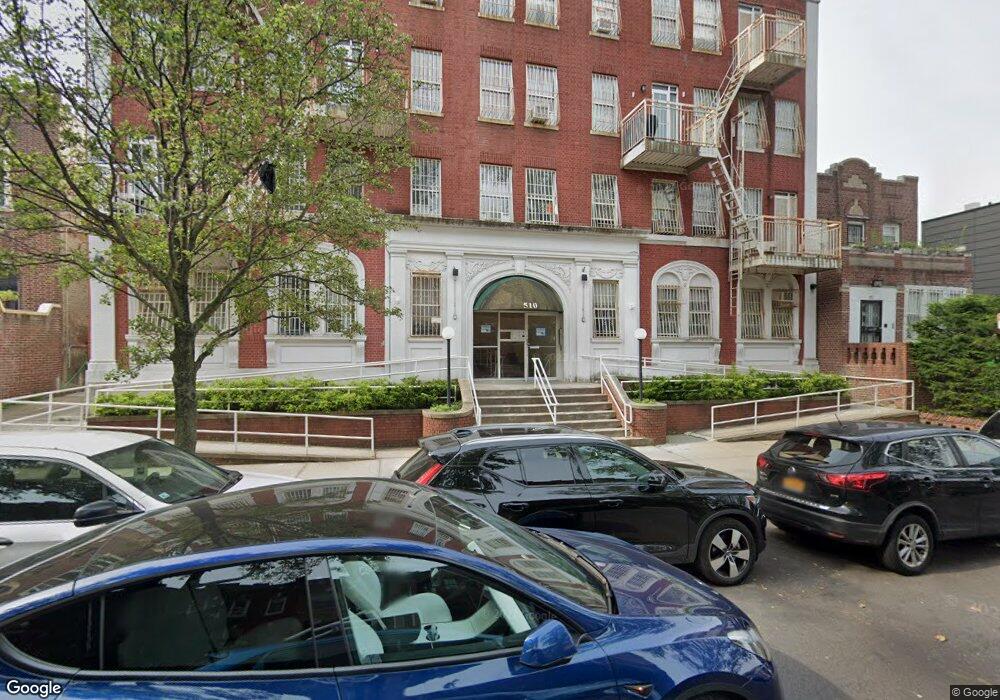
510 Crown St Unit 3C New York, NY 11213
Crown Heights NeighborhoodEstimated Value: $509,000 - $709,000
--
Bed
--
Bath
1,327
Sq Ft
$435/Sq Ft
Est. Value
About This Home
This home is located at 510 Crown St Unit 3C, New York, NY 11213 and is currently estimated at $577,667, approximately $435 per square foot. 510 Crown St Unit 3C is a home located in Kings County with nearby schools including P.S. 221 Toussaint L'Ouverture, New Heights Middle School, and Achievement First Crown Heights Elementary School.
Ownership History
Date
Name
Owned For
Owner Type
Purchase Details
Closed on
Jun 2, 2003
Sold by
Lazaroff Shneur Z and Lazaroff Yocheved M
Bought by
Lazaroff Yocheved M
Current Estimated Value
Purchase Details
Closed on
Jul 3, 2002
Sold by
Feinstein Norman W and Feinstein Judith S
Bought by
Lazaroff Shneu Zalmen and Lazaroff Yochevrd Miria
Home Financials for this Owner
Home Financials are based on the most recent Mortgage that was taken out on this home.
Original Mortgage
$228,000
Interest Rate
6.25%
Mortgage Type
Purchase Money Mortgage
Purchase Details
Closed on
Nov 5, 1993
Sold by
510 Crown Realty Corp
Bought by
Feinstein Norman W and Feinstein Judith S
Home Financials for this Owner
Home Financials are based on the most recent Mortgage that was taken out on this home.
Original Mortgage
$112,500
Interest Rate
6.33%
Mortgage Type
Purchase Money Mortgage
Create a Home Valuation Report for This Property
The Home Valuation Report is an in-depth analysis detailing your home's value as well as a comparison with similar homes in the area
Home Values in the Area
Average Home Value in this Area
Purchase History
| Date | Buyer | Sale Price | Title Company |
|---|---|---|---|
| Lazaroff Yocheved M | -- | -- | |
| Lazaroff Yocheved M | -- | -- | |
| Lazaroff Shneu Zalmen | -- | -- | |
| Lazaroff Shneu Zalmen | -- | -- | |
| Feinstein Norman W | -- | -- | |
| Feinstein Norman W | -- | -- |
Source: Public Records
Mortgage History
| Date | Status | Borrower | Loan Amount |
|---|---|---|---|
| Previous Owner | Lazaroff Shneu Zalmen | $228,000 | |
| Previous Owner | Feinstein Norman W | $112,500 |
Source: Public Records
Tax History Compared to Growth
Tax History
| Year | Tax Paid | Tax Assessment Tax Assessment Total Assessment is a certain percentage of the fair market value that is determined by local assessors to be the total taxable value of land and additions on the property. | Land | Improvement |
|---|---|---|---|---|
| 2025 | $12,830 | $118,765 | $8,384 | $110,381 |
| 2024 | $12,830 | $114,350 | $8,384 | $105,966 |
| 2023 | $9,894 | $108,482 | $8,384 | $100,098 |
| 2022 | $9,435 | $100,070 | $8,384 | $91,686 |
| 2021 | $9,420 | $98,505 | $8,383 | $90,122 |
| 2020 | $4,469 | $91,715 | $8,383 | $83,332 |
| 2019 | $9,054 | $105,017 | $8,383 | $96,634 |
| 2018 | $10,471 | $106,526 | $8,383 | $98,143 |
| 2017 | $9,491 | $103,899 | $8,383 | $95,516 |
| 2016 | $8,336 | $98,478 | $8,383 | $90,095 |
| 2015 | $2,667 | $62,624 | $8,382 | $54,242 |
| 2014 | $2,667 | $77,444 | $9,223 | $68,221 |
Source: Public Records
Map
Nearby Homes
- 1478 Union St
- 421 Crown St Unit 16R
- 1433 Union St
- 446 Kingston Ave Unit D9
- 20 Lamont Ct
- 773 Eastern Pkwy Unit 3C
- 773 Eastern Pkwy Unit 2A
- 773 Eastern Pkwy Unit 2B
- 773 Eastern Pkwy Unit 1A
- 767 Eastern Pkwy Unit 4B
- 767 Eastern Pkwy Unit 1A
- 767 Eastern Pkwy Unit 1B
- 294 Albany Ave
- 975 Lincoln Place
- 704 Lefferts Ave
- 556 E New York Ave
- 248 Avenue S
- 602 Maple St
- 1148 Sterling Place
- 1050 Sterling Place
- 510 Crown St Unit 1C
- 510 Crown St Unit 3G
- 510 Crown St Unit 3B
- 510 Crown St Unit 2D
- 510 Crown St Unit 2A
- 510 Crown St Unit 3D
- 510 Crown St Unit 2C
- 510 Crown St Unit 1D
- 510 Crown St Unit 2B
- 510 Crown St Unit 3E
- 510 Crown St Unit 1A
- 510 Crown St Unit 3A
- 510 Crown St Unit 1B
- 510 Crown St Unit 3f
- 504-510 Crown St
- 502 Crown St
- 514 Crown St
- 389 Kingston Ave
- 393 Kingston Ave
- 395 Kingston Ave