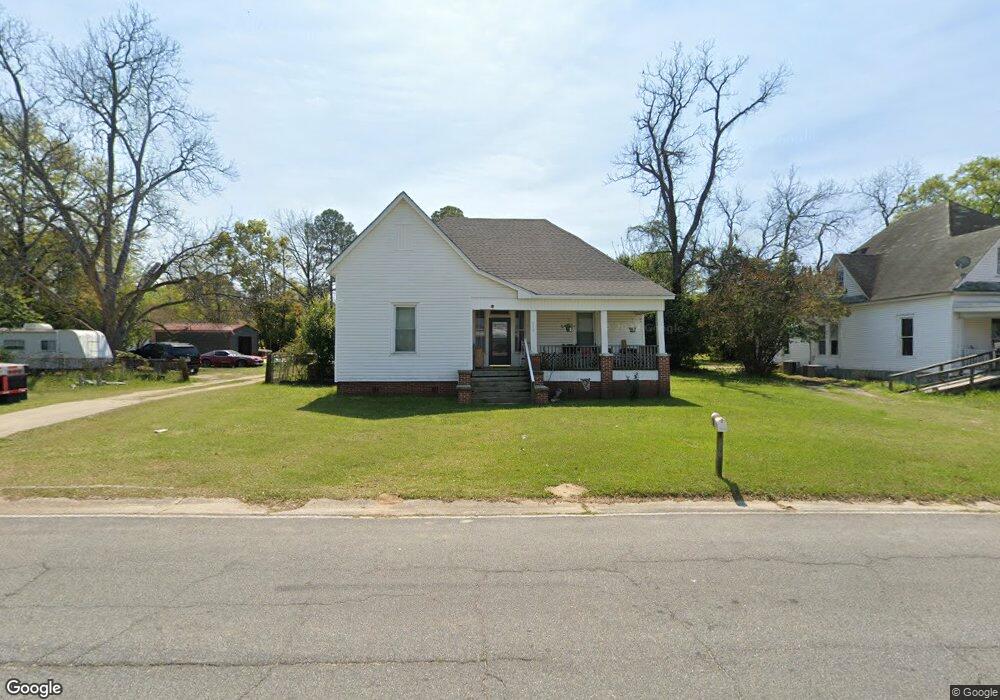
510 E 17th Ave Cordele, GA 31015
Estimated Value: $117,000 - $169,999
2
Beds
1
Bath
2,079
Sq Ft
$73/Sq Ft
Est. Value
About This Home
This home is located at 510 E 17th Ave, Cordele, GA 31015 and is currently estimated at $151,500, approximately $72 per square foot. 510 E 17th Ave is a home located in Crisp County with nearby schools including Crisp County Elementary School, Crisp County Primary School, and Crisp County Middle School.
Ownership History
Date
Name
Owned For
Owner Type
Purchase Details
Closed on
Mar 21, 2025
Sold by
Atkins James Thomas
Bought by
Atkins Marilyn Renea
Current Estimated Value
Home Financials for this Owner
Home Financials are based on the most recent Mortgage that was taken out on this home.
Original Mortgage
$83,460
Outstanding Balance
$82,885
Interest Rate
6.85%
Mortgage Type
New Conventional
Estimated Equity
$68,615
Purchase Details
Closed on
Nov 4, 2019
Sold by
Atkins Henry
Bought by
Atkins James
Purchase Details
Closed on
Oct 5, 2016
Sold by
Wanda W
Bought by
Atkins Henry L and Atkins James T
Purchase Details
Closed on
Nov 7, 2000
Sold by
Sinnott Vicki and Sinnott Micha
Bought by
Atkins Wanda
Purchase Details
Closed on
May 8, 1997
Sold by
Pridgen Anna Margar
Bought by
Sinnott Vicki and Sinnott Micha
Purchase Details
Closed on
Sep 4, 1996
Sold by
Pridgen W C
Bought by
Pridgen Anna Margar
Purchase Details
Closed on
Apr 14, 1981
Bought by
Pridgen W C
Purchase Details
Closed on
Feb 27, 1934
Bought by
Parrish W E
Create a Home Valuation Report for This Property
The Home Valuation Report is an in-depth analysis detailing your home's value as well as a comparison with similar homes in the area
Purchase History
We collect this data history from publicly available records. To have your information removed, we recommend requesting removal directly through your county’s website.
| Date | Buyer | Sale Price | Title Company |
|---|---|---|---|
| Atkins Marilyn Renea | $85,000 | -- | |
| Atkins James | -- | -- | |
| Atkins Henry L | -- | -- | |
| Atkins Wanda | $27,900 | -- | |
| Sinnott Vicki | $32,000 | -- | |
| Pridgen Anna Margar | -- | -- | |
| Pridgen W C | $17,500 | -- | |
| Parrish W E | -- | -- |
Source: Public Records
Mortgage History
We collect this data history from publicly available records. To have your information removed, we recommend requesting removal directly through your county’s website.
| Date | Status | Borrower | Loan Amount |
|---|---|---|---|
| Open | Atkins Marilyn Renea | $83,460 | |
| Closed | Atkins Marilyn Renea | $83,460 |
Source: Public Records
Tax History
| Year | Tax Paid | Tax Assessment Tax Assessment Total Assessment is a certain percentage of the fair market value that is determined by local assessors to be the total taxable value of land and additions on the property. | Land | Improvement |
|---|---|---|---|---|
| 2025 | $1,993 | $59,534 | $6,000 | $53,534 |
| 2024 | $1,884 | $53,944 | $6,000 | $47,944 |
| 2023 | $1,770 | $48,625 | $3,000 | $45,625 |
| 2022 | $1,159 | $45,830 | $3,000 | $42,830 |
| 2021 | $1,135 | $43,036 | $3,000 | $40,036 |
| 2020 | $1,155 | $43,036 | $3,000 | $40,036 |
| 2019 | $1,164 | $43,036 | $3,000 | $40,036 |
| 2018 | $747 | $27,352 | $5,700 | $21,652 |
| 2017 | $1,111 | $27,352 | $5,700 | $21,652 |
| 2016 | $750 | $27,352 | $5,700 | $21,652 |
| 2015 | -- | $27,352 | $5,700 | $21,652 |
| 2014 | -- | $27,352 | $5,700 | $21,652 |
| 2013 | -- | $27,352 | $5,700 | $21,652 |
Source: Public Records
Map
Nearby Homes
Your Personal Tour Guide
Ask me questions while you tour the home.