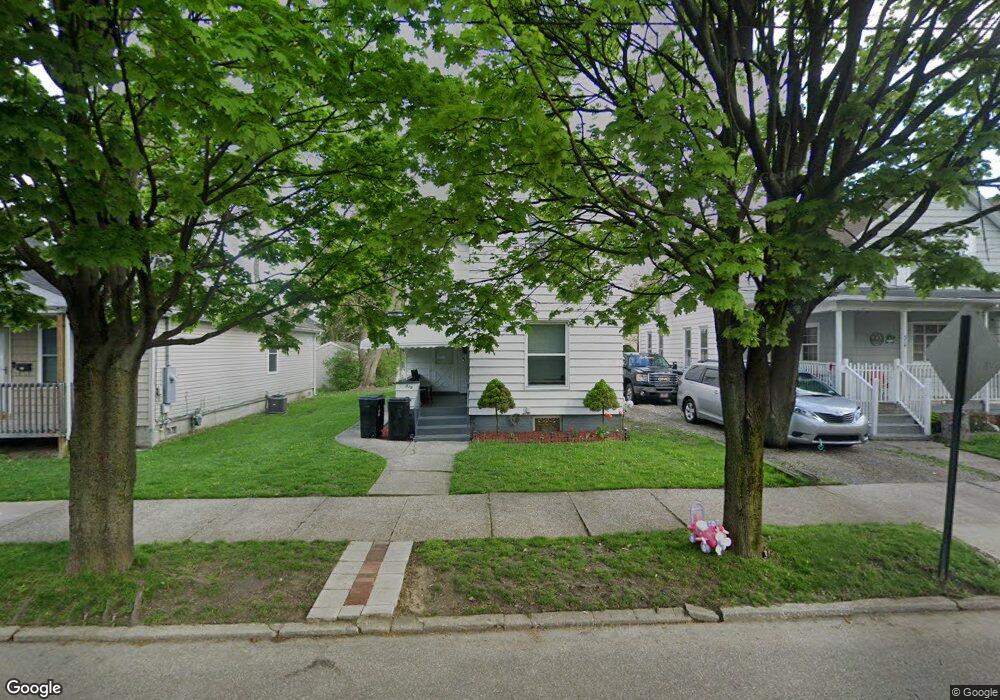
510 E 4th St Erie, PA 16507
East Bayfront NeighborhoodEstimated Value: $81,286 - $101,000
3
Beds
1
Bath
1,378
Sq Ft
$66/Sq Ft
Est. Value
About This Home
This home is located at 510 E 4th St, Erie, PA 16507 and is currently estimated at $91,572, approximately $66 per square foot. 510 E 4th St is a home located in Erie County with nearby schools including Pfeiffer-Burleigh Elementary School, East Middle School, and Erie High School.
Ownership History
Date
Name
Owned For
Owner Type
Purchase Details
Closed on
Jun 19, 2008
Sold by
Greater Erie Area Habitat For Humanity
Bought by
Gamble Larry A and Gamble Yvonne T
Current Estimated Value
Home Financials for this Owner
Home Financials are based on the most recent Mortgage that was taken out on this home.
Original Mortgage
$57,552
Outstanding Balance
$27,686
Interest Rate
6.1%
Mortgage Type
Purchase Money Mortgage
Estimated Equity
$63,886
Purchase Details
Closed on
Jun 19, 2006
Sold by
Johnson Christine M and Drew Christine M
Bought by
Greater Erie Area Habitat For Humanity I
Purchase Details
Closed on
Sep 19, 2002
Sold by
Greater Erie Area Habitat For Humanity I
Bought by
Johnson Christine M
Purchase Details
Closed on
Aug 2, 1999
Sold by
Ted Fitzcharles and Ted Barbara M
Bought by
First National Bank Of Pennsylvania
Create a Home Valuation Report for This Property
The Home Valuation Report is an in-depth analysis detailing your home's value as well as a comparison with similar homes in the area
Home Values in the Area
Average Home Value in this Area
Purchase History
| Date | Buyer | Sale Price | Title Company |
|---|---|---|---|
| Gamble Larry A | $54,900 | None Available | |
| Greater Erie Area Habitat For Humanity I | $37,440 | None Available | |
| Johnson Christine M | $36,000 | -- | |
| First National Bank Of Pennsylvania | $1,431 | -- |
Source: Public Records
Mortgage History
| Date | Status | Borrower | Loan Amount |
|---|---|---|---|
| Open | Gamble Larry A | $57,552 |
Source: Public Records
Tax History Compared to Growth
Tax History
| Year | Tax Paid | Tax Assessment Tax Assessment Total Assessment is a certain percentage of the fair market value that is determined by local assessors to be the total taxable value of land and additions on the property. | Land | Improvement |
|---|---|---|---|---|
| 2025 | $1,530 | $38,700 | $7,700 | $31,000 |
| 2024 | $1,497 | $38,700 | $7,700 | $31,000 |
| 2023 | $1,455 | $38,700 | $7,700 | $31,000 |
| 2022 | $1,424 | $38,700 | $7,700 | $31,000 |
| 2021 | $1,404 | $38,700 | $7,700 | $31,000 |
| 2020 | $1,394 | $38,700 | $7,700 | $31,000 |
| 2019 | $1,322 | $38,700 | $7,700 | $31,000 |
| 2018 | $1,306 | $38,700 | $7,700 | $31,000 |
| 2017 | $1,304 | $38,700 | $7,700 | $31,000 |
| 2016 | $1,136 | $38,700 | $7,700 | $31,000 |
| 2015 | $1,127 | $38,700 | $7,700 | $31,000 |
| 2014 | $927 | $38,700 | $7,700 | $31,000 |
Source: Public Records
Map
Nearby Homes