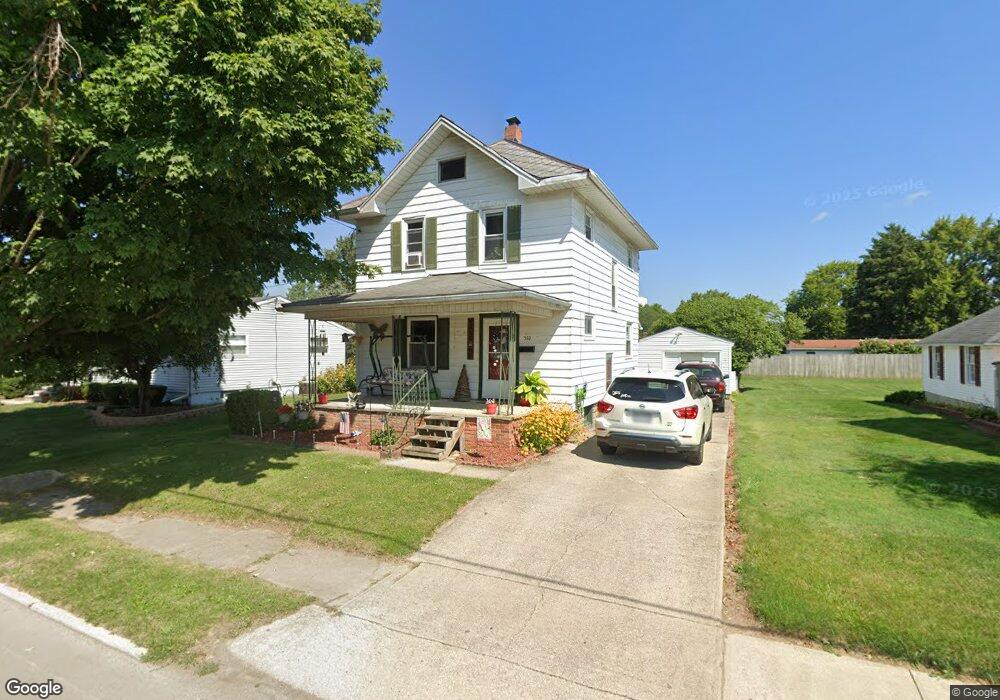
510 E Irving St Bucyrus, OH 44820
Estimated Value: $94,000 - $154,000
3
Beds
1
Bath
572
Sq Ft
$196/Sq Ft
Est. Value
About This Home
This home is located at 510 E Irving St, Bucyrus, OH 44820 and is currently estimated at $112,027, approximately $195 per square foot. 510 E Irving St is a home located in Crawford County with nearby schools including Bucyrus Elementary School, Bucyrus Secondary School, and Holy Trinity School.
Ownership History
Date
Name
Owned For
Owner Type
Purchase Details
Closed on
Oct 16, 2024
Sold by
Durham Charles A
Bought by
Durham Stevi S
Current Estimated Value
Purchase Details
Closed on
Aug 20, 2021
Sold by
Robinett Michael D and Robinett Monica J
Bought by
Durham Charles A and Durham Stevi S
Home Financials for this Owner
Home Financials are based on the most recent Mortgage that was taken out on this home.
Original Mortgage
$82,000
Interest Rate
2.9%
Mortgage Type
Purchase Money Mortgage
Purchase Details
Closed on
Jun 24, 2021
Sold by
Robinette Michael D and Robinett Michael D
Bought by
Durham Charles A and Durham Stevi S
Home Financials for this Owner
Home Financials are based on the most recent Mortgage that was taken out on this home.
Original Mortgage
$82,000
Interest Rate
2.9%
Mortgage Type
Purchase Money Mortgage
Purchase Details
Closed on
Jan 21, 2021
Sold by
Eidson Ernestine Kay and Eidson Ernestine K
Bought by
Robinett Michael D and Robinett Michael
Home Financials for this Owner
Home Financials are based on the most recent Mortgage that was taken out on this home.
Original Mortgage
$80,000
Interest Rate
5%
Mortgage Type
Stand Alone Second
Purchase Details
Closed on
Mar 17, 2015
Sold by
Eidson Leroy D and Eidson Ernestine Kay
Bought by
Eidson Leroy D and Eidson Ernestine Kay
Purchase Details
Closed on
Jan 6, 2012
Sold by
Citizens Banking Co
Bought by
Mee James D and Mee Sue E
Create a Home Valuation Report for This Property
The Home Valuation Report is an in-depth analysis detailing your home's value as well as a comparison with similar homes in the area
Home Values in the Area
Average Home Value in this Area
Purchase History
| Date | Buyer | Sale Price | Title Company |
|---|---|---|---|
| Durham Stevi S | -- | None Listed On Document | |
| Durham Charles A | $85,000 | None Available | |
| Durham Charles A | -- | None Listed On Document | |
| Robinett Michael D | $90,000 | Acs Title Bucyrus | |
| Eidson Leroy D | -- | Attorney | |
| Mee James D | $27,500 | None Available |
Source: Public Records
Mortgage History
| Date | Status | Borrower | Loan Amount |
|---|---|---|---|
| Previous Owner | Durham Charles A | $82,000 | |
| Previous Owner | Durham Charles A | $82,000 | |
| Previous Owner | Robinett Michael D | $80,000 |
Source: Public Records
Tax History
| Year | Tax Paid | Tax Assessment Tax Assessment Total Assessment is a certain percentage of the fair market value that is determined by local assessors to be the total taxable value of land and additions on the property. | Land | Improvement |
|---|---|---|---|---|
| 2024 | $979 | $21,990 | $3,140 | $18,850 |
| 2023 | $992 | $19,150 | $2,450 | $16,700 |
| 2022 | $1,022 | $19,150 | $2,450 | $16,700 |
| 2021 | $1,019 | $19,150 | $2,450 | $16,700 |
| 2020 | $838 | $14,930 | $2,450 | $12,480 |
| 2019 | $857 | $14,930 | $2,450 | $12,480 |
| 2018 | $853 | $14,930 | $2,450 | $12,480 |
| 2017 | $871 | $14,710 | $2,450 | $12,260 |
| 2016 | $845 | $14,710 | $2,450 | $12,260 |
| 2015 | $833 | $14,710 | $2,450 | $12,260 |
| 2014 | $829 | $14,710 | $2,450 | $12,260 |
| 2013 | $829 | $14,710 | $2,450 | $12,260 |
Source: Public Records
Map
Nearby Homes
- 601 E Irving St
- 800 High St
- 199 Dudley St
- 1200 N Sandusky Ave
- 116 Melcher Blvd
- 210 N Walnut St
- 414 River St
- 407 E Mansfield St
- 941 Reid St
- 1001 Reid St
- 1201 Reid St
- 412 E Rensselaer St
- 317 E Rensselaer St
- 1023 Tiffin St Unit Lot 5
- 1023 Tiffin St Unit 17
- 1023 Tiffin St Unit 33
- 1023 Tiffin St Unit 30
- 231 E Rensselaer St
- 223 E Rensselaer St
- 924 E Warren St
Your Personal Tour Guide
Ask me questions while you tour the home.