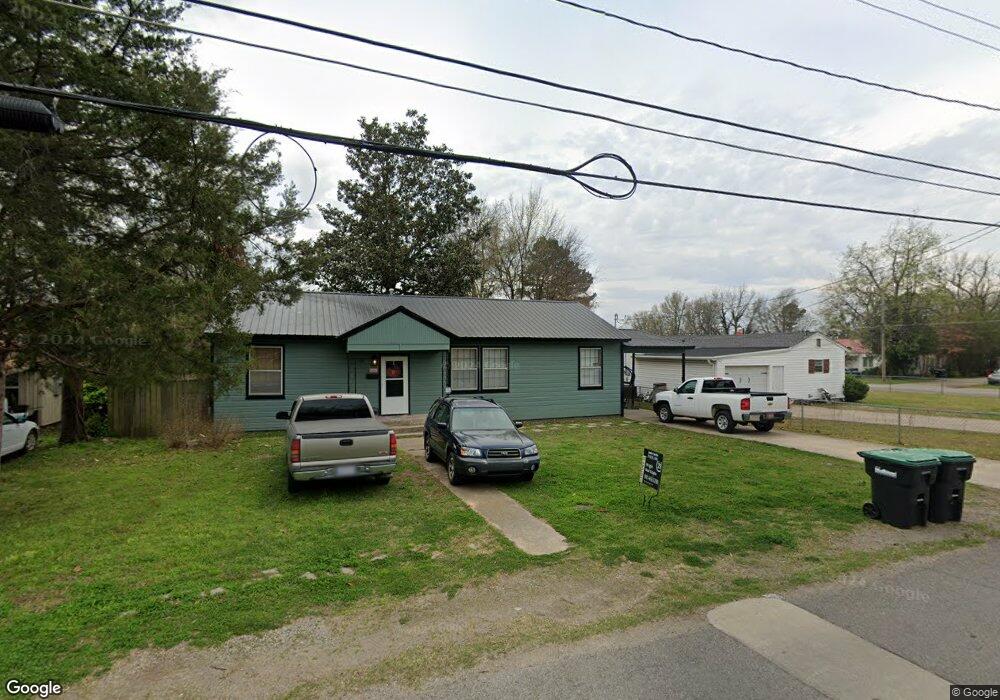
510 E Shawnee St Tahlequah, OK 74464
Estimated Value: $132,974 - $184,000
3
Beds
1
Bath
1,250
Sq Ft
$120/Sq Ft
Est. Value
About This Home
This home is located at 510 E Shawnee St, Tahlequah, OK 74464 and is currently estimated at $150,244, approximately $120 per square foot. 510 E Shawnee St is a home located in Cherokee County with nearby schools including Cherokee Elementary School, Greenwood Elementary School, and Tahlequah Middle School.
Ownership History
Date
Name
Owned For
Owner Type
Purchase Details
Closed on
Jun 3, 2024
Sold by
Morrison Matthew and Morrison Rayleigh
Bought by
Black Oak Rental Properties Llc
Current Estimated Value
Home Financials for this Owner
Home Financials are based on the most recent Mortgage that was taken out on this home.
Original Mortgage
$141,852
Outstanding Balance
$138,979
Interest Rate
7.17%
Mortgage Type
Credit Line Revolving
Estimated Equity
$11,265
Purchase Details
Closed on
Mar 13, 2023
Sold by
Glasby Rebecca E and Glasby John S
Bought by
Morrison Matthew
Purchase Details
Closed on
Jul 31, 2006
Sold by
Marsh Mary Lee
Bought by
Glasby Rebecca E and Glasby John
Home Financials for this Owner
Home Financials are based on the most recent Mortgage that was taken out on this home.
Original Mortgage
$46,000
Interest Rate
5.31%
Mortgage Type
FHA
Purchase Details
Closed on
Jun 24, 2003
Sold by
Jackie and Glenn Hollowell
Bought by
David and Mary Lee Marsh,Jr
Create a Home Valuation Report for This Property
The Home Valuation Report is an in-depth analysis detailing your home's value as well as a comparison with similar homes in the area
Home Values in the Area
Average Home Value in this Area
Purchase History
| Date | Buyer | Sale Price | Title Company |
|---|---|---|---|
| Black Oak Rental Properties Llc | -- | None Listed On Document | |
| Morrison Matthew | $76,000 | -- | |
| Glasby Rebecca E | $55,000 | None Available | |
| David | -- | -- |
Source: Public Records
Mortgage History
| Date | Status | Borrower | Loan Amount |
|---|---|---|---|
| Open | Black Oak Rental Properties Llc | $141,852 | |
| Previous Owner | Glasby Rebecca E | $15,000 | |
| Previous Owner | Glasby Rebecca E | $46,000 |
Source: Public Records
Tax History Compared to Growth
Tax History
| Year | Tax Paid | Tax Assessment Tax Assessment Total Assessment is a certain percentage of the fair market value that is determined by local assessors to be the total taxable value of land and additions on the property. | Land | Improvement |
|---|---|---|---|---|
| 2025 | $792 | $8,778 | $1,790 | $6,988 |
| 2024 | $792 | $8,360 | $1,705 | $6,655 |
| 2023 | $792 | $7,397 | $1,143 | $6,254 |
| 2022 | $686 | $7,397 | $1,143 | $6,254 |
| 2021 | $689 | $7,397 | $1,143 | $6,254 |
| 2020 | $701 | $7,397 | $1,143 | $6,254 |
| 2019 | $669 | $7,121 | $1,143 | $5,978 |
| 2018 | $645 | $6,782 | $1,143 | $5,639 |
| 2017 | $644 | $6,782 | $1,143 | $5,639 |
| 2016 | $637 | $6,670 | $1,125 | $5,545 |
| 2015 | $569 | $6,352 | $1,015 | $5,337 |
| 2014 | $569 | $6,050 | $509 | $5,541 |
Source: Public Records
Map
Nearby Homes
- 619 E Cherrie St
- 111 N Logan Dr
- 101 S Harrison Ave
- 609 E Ward St
- 605 E Ward St
- 103 S Harrison Ave
- 104 Tommye Ln
- 215 S Maple Ave
- 200 Remington Place
- 403 S Bluff Ave
- 640 N Oklahoma Ave
- 605 S Oak Ave
- 508 Covington Place
- 0 S Hwy 82 A Hwy Unit 2532332
- 717 N Oklahoma Ave
- 1025 E Downing St
- 710 Victor St
- 204 Woodhaven Ave
- 707 Victor St
- 508 Garden Rd
- 106 N Ash Ave
- 518 E Shawnee St
- 104 N Ash Ave
- 107 N East Ave
- 505 E Boone St
- 501 E Boone St
- 521 E Shawnee St
- 501 E Shawnee St
- 503 E Shawnee St
- 418 E Shawnee St
- 105 N Ash Ave
- 101 N East Ave
- 51 East Dr
- 106 N East Ave
- 203 N East Ave
- 415 E Shawnee St
- 100 N Ash Ave
- 204 N Ash Ave
- 410 E Shawnee St
- 207 N East Ave