
Seller's Agent in 2025
Dominai Reeves
Keller Williams Realty Atl. Partners
(678) 467-9346
1 in this area
132 Total Sales
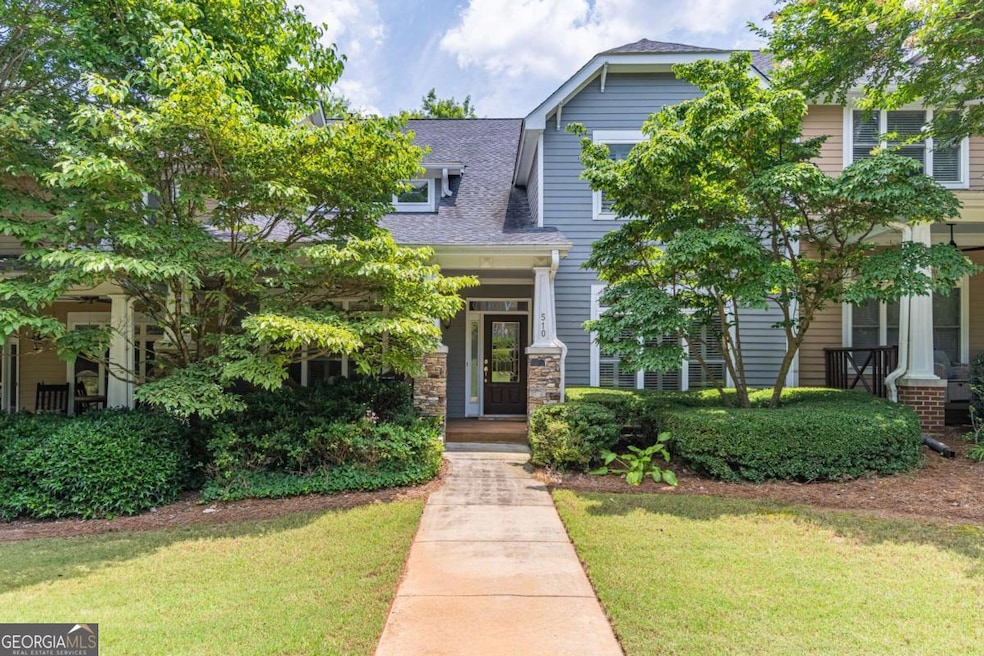
Welcome to a perfect blend of comfort and convenience in this beautifully renovated townhome, located in a highly desirable gated community! The main level features a stunning two-story great room, a well-appointed kitchen with a cozy breakfast nook, and a separate dining room ideal for entertaining. A convenient half bath is also available for guests. The spacious owner's suite on the main floor boasts a newly renovated spa-like bathroom complete with a luxurious soaking tub. Upstairs, you'll find an open media room-perfect for relaxing or hosting movie nights-along with two additional bedrooms that share a stylish Jack-and-Jill bathroom. This exceptional townhome truly has it all-style, space, and updates throughout.
Last Agent to Sell the Property
Keller Williams Realty Atl. Partners License #253527 Listed on: 06/26/2025
| Date | Type | Sale Price | Title Company |
|---|---|---|---|
| Warranty Deed | $220,000 | -- | |
| Deed | $268,000 | -- | |
| Deed | $214,000 | -- |
| Date | Status | Loan Amount | Loan Type |
|---|---|---|---|
| Open | $175,780 | New Conventional | |
| Closed | $20,910 | New Conventional | |
| Previous Owner | $150,000 | New Conventional | |
| Previous Owner | $171,150 | New Conventional |
| Date | Event | Price | List to Sale | Price per Sq Ft |
|---|---|---|---|---|
| 09/05/2025 09/05/25 | Sold | $585,500 | 0.0% | $229 / Sq Ft |
| 07/22/2025 07/22/25 | Pending | -- | -- | -- |
| 07/11/2025 07/11/25 | Price Changed | $585,500 | -1.6% | $229 / Sq Ft |
| 06/26/2025 06/26/25 | For Sale | $595,000 | -- | $233 / Sq Ft |
| Year | Tax Paid | Tax Assessment Tax Assessment Total Assessment is a certain percentage of the fair market value that is determined by local assessors to be the total taxable value of land and additions on the property. | Land | Improvement |
|---|---|---|---|---|
| 2025 | $688 | $201,040 | $25,320 | $175,720 |
| 2023 | $688 | $197,720 | $22,760 | $174,960 |
| 2022 | $1,807 | $171,000 | $23,560 | $147,440 |
| 2021 | $2,315 | $157,440 | $14,440 | $143,000 |
| 2020 | $2,340 | $158,720 | $18,720 | $140,000 |
| 2019 | $547 | $150,400 | $15,800 | $134,600 |
| 2018 | $2,210 | $134,160 | $16,880 | $117,280 |
| 2017 | $1,740 | $103,800 | $17,680 | $86,120 |
| 2016 | $1,734 | $103,800 | $17,680 | $86,120 |
| 2015 | $2,302 | $103,800 | $17,680 | $86,120 |
| 2014 | $1,468 | $89,360 | $11,400 | $77,960 |
Seller's Agent in 2025
Dominai Reeves
Keller Williams Realty Atl. Partners
(678) 467-9346
1 in this area
132 Total Sales
K
Seller Co-Listing Agent in 2025
Kelly Skelton
Keller Williams Realty Atl. Partners
(678) 622-3811
1 in this area
47 Total Sales
Buyer's Agent in 2025
Glenda Broker
Non-Mls Company
(800) 289-1214
Source: Georgia MLS
MLS Number: 10551533
APN: 12-2004-0426-135-7
Disclaimer: Certain information contained herein is derived from information provided by parties other than Homes.com. All information provided is deemed reliable, but is not guaranteed to be accurate and should be independently verified.
![]() The data relating to real estate for sale on this web site comes in part from the Broker Reciprocity Program of Georgia MLS. Real estate listings held by brokerage firms other than Redfin are marked with the Broker Reciprocity logo and detailed information about them includes the name of the listing brokers. Information deemed reliable but not guaranteed. Copyright 2025 Georgia MLS. All rights reserved.
The data relating to real estate for sale on this web site comes in part from the Broker Reciprocity Program of Georgia MLS. Real estate listings held by brokerage firms other than Redfin are marked with the Broker Reciprocity logo and detailed information about them includes the name of the listing brokers. Information deemed reliable but not guaranteed. Copyright 2025 Georgia MLS. All rights reserved.