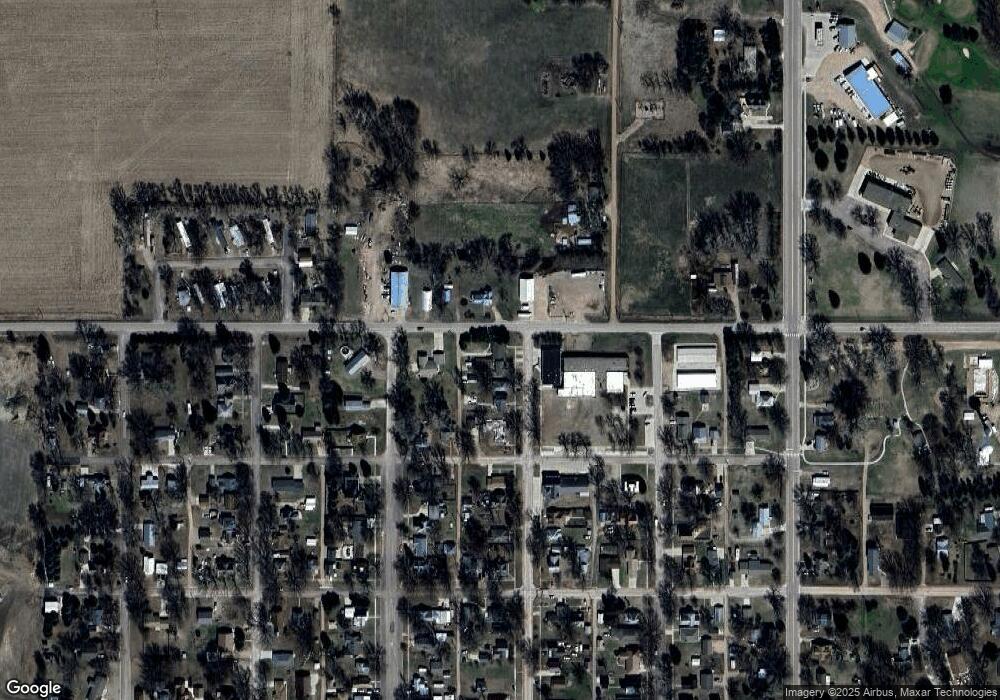
510 Iowa St Alcester, SD 57001
Estimated Value: $121,000 - $211,000
3
Beds
1
Bath
1,120
Sq Ft
$154/Sq Ft
Est. Value
About This Home
This home is located at 510 Iowa St, Alcester, SD 57001 and is currently estimated at $172,800, approximately $154 per square foot. 510 Iowa St is a home located in Union County with nearby schools including Alcester-Hudson Elementary School and Alcester-Hudson Junior High School.
Ownership History
Date
Name
Owned For
Owner Type
Purchase Details
Closed on
Jul 23, 2021
Sold by
Seivert Katie A
Bought by
Tifft Denise A
Current Estimated Value
Home Financials for this Owner
Home Financials are based on the most recent Mortgage that was taken out on this home.
Original Mortgage
$120,000
Outstanding Balance
$108,981
Interest Rate
2.96%
Mortgage Type
New Conventional
Estimated Equity
$63,819
Purchase Details
Closed on
Dec 29, 2017
Sold by
Berg Gerald Rodney
Bought by
Seivert Katie A
Home Financials for this Owner
Home Financials are based on the most recent Mortgage that was taken out on this home.
Original Mortgage
$47,222
Interest Rate
3.95%
Mortgage Type
New Conventional
Purchase Details
Closed on
Aug 18, 2010
Sold by
Berg Rodney C and Berg Patricia
Bought by
Berg Gerald Rodney
Create a Home Valuation Report for This Property
The Home Valuation Report is an in-depth analysis detailing your home's value as well as a comparison with similar homes in the area
Home Values in the Area
Average Home Value in this Area
Purchase History
| Date | Buyer | Sale Price | Title Company |
|---|---|---|---|
| Tifft Denise A | $150,500 | None Available | |
| Seivert Katie A | $47,000 | None Available | |
| Berg Gerald Rodney | -- | None Available |
Source: Public Records
Mortgage History
| Date | Status | Borrower | Loan Amount |
|---|---|---|---|
| Open | Tifft Denise A | $120,000 | |
| Previous Owner | Seivert Katie A | $47,222 |
Source: Public Records
Tax History Compared to Growth
Tax History
| Year | Tax Paid | Tax Assessment Tax Assessment Total Assessment is a certain percentage of the fair market value that is determined by local assessors to be the total taxable value of land and additions on the property. | Land | Improvement |
|---|---|---|---|---|
| 2025 | $1,717 | $102,008 | $9,371 | $92,637 |
| 2024 | $1,717 | $88,363 | $7,809 | $80,554 |
| 2023 | $1,582 | $78,809 | $5,578 | $73,231 |
| 2022 | $1,372 | $70,559 | $3,985 | $66,574 |
| 2021 | $1,135 | $61,355 | $3,465 | $57,890 |
| 2020 | $1,135 | $50,300 | $3,465 | $46,835 |
| 2019 | -- | $50,300 | $3,465 | $46,835 |
| 2018 | $1,037 | $48,070 | $3,465 | $44,605 |
| 2017 | $978 | $48,070 | $0 | $48,070 |
| 2016 | $1,037 | $48,070 | $0 | $48,070 |
| 2015 | $1,037 | $48,070 | $0 | $48,070 |
| 2014 | $985 | $44,015 | $0 | $44,015 |
| 2013 | $964 | $44,015 | $0 | $44,015 |
| 2012 | $964 | $44,015 | $3,465 | $40,550 |
Source: Public Records
Map
Nearby Homes