Estimated Value: $556,000 - $600,711
3
Beds
3
Baths
1,771
Sq Ft
$324/Sq Ft
Est. Value
About This Home
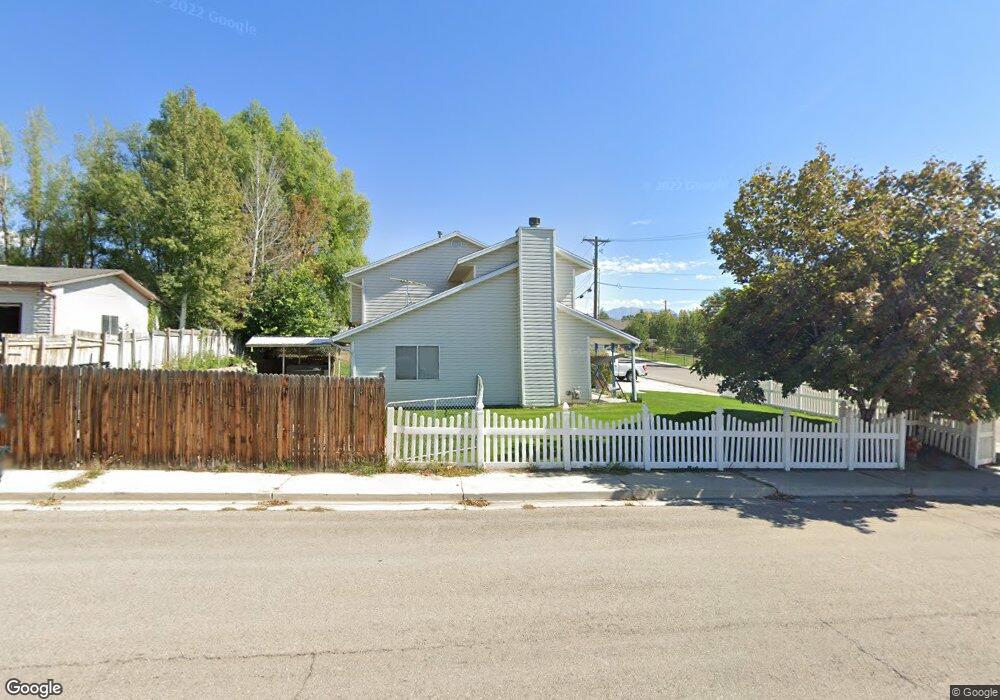
This home is located at 510 N 1150 E, Lehi, UT 84043 and is currently estimated at $573,678, approximately $323 per square foot. 510 N 1150 E is a home located in Utah County with nearby schools including Sego Lily Elementary School, Lehi Junior High School, and Skyridge High School.
Ownership History
Date
Name
Owned For
Owner Type
Purchase Details
Closed on
Jun 24, 2020
Sold by
Murie Ben and Murie Teressa M
Bought by
Murie Ben and Murie Teresa
Current Estimated Value
Home Financials for this Owner
Home Financials are based on the most recent Mortgage that was taken out on this home.
Original Mortgage
$242,000
Outstanding Balance
$214,514
Interest Rate
3.2%
Mortgage Type
New Conventional
Estimated Equity
$359,164
Purchase Details
Closed on
Dec 19, 2003
Sold by
Rothe Dale K
Bought by
Murie Ben and Murie Teressa M
Home Financials for this Owner
Home Financials are based on the most recent Mortgage that was taken out on this home.
Original Mortgage
$154,574
Interest Rate
6.03%
Mortgage Type
FHA
Purchase Details
Closed on
Aug 4, 1997
Sold by
Hampton Tyler C and Hampton Kerri L
Bought by
Rothe Dale K
Home Financials for this Owner
Home Financials are based on the most recent Mortgage that was taken out on this home.
Original Mortgage
$33,320
Interest Rate
7.57%
Create a Home Valuation Report for This Property
The Home Valuation Report is an in-depth analysis detailing your home's value as well as a comparison with similar homes in the area
Home Values in the Area
Average Home Value in this Area
Purchase History
| Date | Buyer | Sale Price | Title Company |
|---|---|---|---|
| Murie Ben | -- | First American Title Ins Co | |
| Murie Ben | -- | Provo Land Title Company | |
| Rothe Dale K | -- | -- |
Source: Public Records
Mortgage History
| Date | Status | Borrower | Loan Amount |
|---|---|---|---|
| Open | Murie Ben | $242,000 | |
| Closed | Murie Ben | $154,574 | |
| Previous Owner | Rothe Dale K | $33,320 |
Source: Public Records
Tax History Compared to Growth
Tax History
| Year | Tax Paid | Tax Assessment Tax Assessment Total Assessment is a certain percentage of the fair market value that is determined by local assessors to be the total taxable value of land and additions on the property. | Land | Improvement |
|---|---|---|---|---|
| 2025 | $2,044 | $273,240 | $195,800 | $301,000 |
| 2024 | $2,044 | $239,195 | $0 | $0 |
| 2023 | $1,864 | $236,830 | $0 | $0 |
| 2022 | $2,057 | $253,440 | $0 | $0 |
| 2021 | $1,832 | $341,100 | $113,300 | $227,800 |
| 2020 | $1,726 | $317,800 | $104,900 | $212,900 |
| 2019 | $1,553 | $297,100 | $104,900 | $192,200 |
| 2018 | $1,474 | $266,600 | $94,100 | $172,500 |
| 2017 | $1,427 | $137,280 | $0 | $0 |
| 2016 | $1,418 | $126,555 | $0 | $0 |
| 2015 | $1,408 | $119,240 | $0 | $0 |
| 2014 | $1,359 | $114,455 | $0 | $0 |
Source: Public Records
Map
Nearby Homes
- 575 N 1200 E
- 595 N 1200 E
- 458 N 1100 E Unit 3
- 418 N 1322 E
- 328 N 1270 E
- 735 N 1000 E
- 1036 E 310 N Unit K1
- 1175 E 900 N
- 901 N Lakota Rd
- 807 N Somerset Alley
- 893 N 1580 E
- 822 N 860 W Unit 317
- 3968 W 1000 N Unit 427
- 3935 W 1000 N Unit 438
- 3983 W 1000 N Unit 442
- 4007 W 1000 N
- 3947 W 1000 N Unit 439
- 3959 W 1000 N
- 822 W 800 St N Unit LOT319
- 428 E 500 N