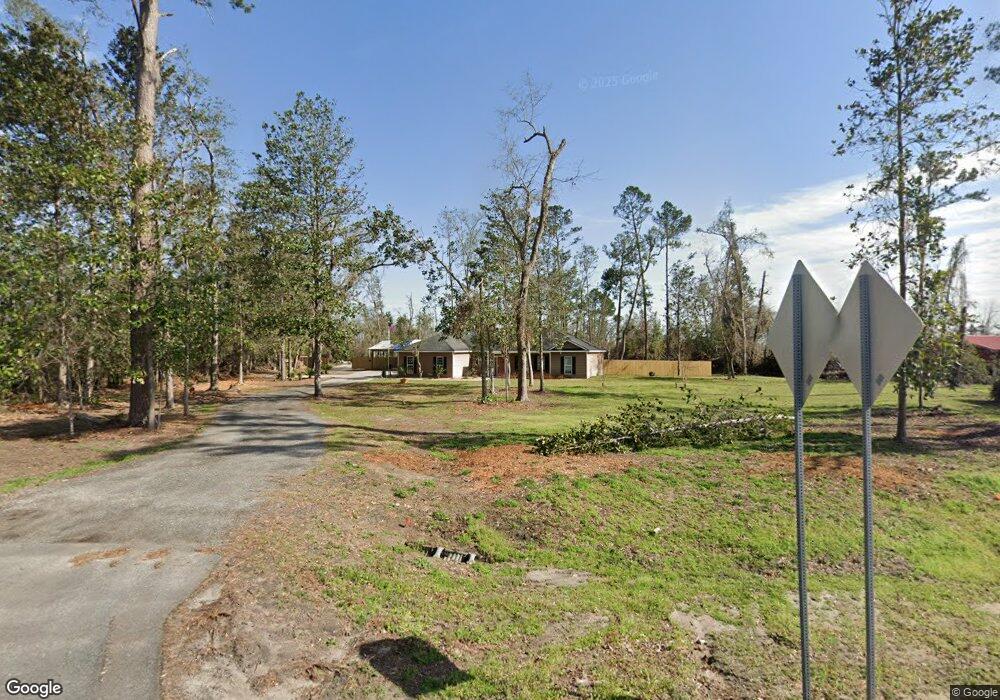
510 N East St Lake Park, GA 31636
Estimated Value: $299,502 - $356,000
--
Bed
--
Bath
2,068
Sq Ft
$158/Sq Ft
Est. Value
About This Home
This home is located at 510 N East St, Lake Park, GA 31636 and is currently estimated at $326,876, approximately $158 per square foot. 510 N East St is a home with nearby schools including Lake Park Elementary School, Lowndes Middle School, and Lowndes High School.
Ownership History
Date
Name
Owned For
Owner Type
Purchase Details
Closed on
May 18, 2012
Sold by
Coggins Amy B and Under Kevin L
Bought by
Banks Charles L and Banks Janet C
Current Estimated Value
Home Financials for this Owner
Home Financials are based on the most recent Mortgage that was taken out on this home.
Original Mortgage
$163,000
Outstanding Balance
$124,941
Interest Rate
5.75%
Mortgage Type
New Conventional
Estimated Equity
$201,935
Purchase Details
Closed on
Dec 2, 2010
Sold by
Vause Ellen Rebecca
Bought by
Coggins Amy B & Kevin L Under The Trust
Purchase Details
Closed on
Aug 12, 2004
Sold by
Carter Paul W and Carter Ora B
Bought by
Vause Ellen Rebecca
Purchase Details
Closed on
Mar 24, 2004
Sold by
Coggins Kevin L and Coggins Amy B
Bought by
Coggins Amy B Living Trust
Purchase Details
Closed on
Jul 23, 2002
Sold by
Circle C Produce Inc
Bought by
Coggins Kevin L and Coggins Amy B
Purchase Details
Closed on
Jan 16, 1984
Bought by
Carter Paul W
Create a Home Valuation Report for This Property
The Home Valuation Report is an in-depth analysis detailing your home's value as well as a comparison with similar homes in the area
Home Values in the Area
Average Home Value in this Area
Purchase History
| Date | Buyer | Sale Price | Title Company |
|---|---|---|---|
| Banks Charles L | -- | -- | |
| Coggins Amy B & Kevin L Under The Trust | -- | -- | |
| Vause Ellen Rebecca | -- | -- | |
| Coggins Amy B Living Trust | -- | -- | |
| Coggins Kevin L | -- | -- | |
| Carter Paul W | -- | -- |
Source: Public Records
Mortgage History
| Date | Status | Borrower | Loan Amount |
|---|---|---|---|
| Open | Banks Charles L | $163,000 |
Source: Public Records
Tax History Compared to Growth
Tax History
| Year | Tax Paid | Tax Assessment Tax Assessment Total Assessment is a certain percentage of the fair market value that is determined by local assessors to be the total taxable value of land and additions on the property. | Land | Improvement |
|---|---|---|---|---|
| 2024 | $2,295 | $83,219 | $7,465 | $75,754 |
| 2023 | $2,295 | $82,730 | $6,976 | $75,754 |
| 2022 | $2,022 | $61,702 | $6,976 | $54,726 |
| 2021 | $2,098 | $61,702 | $6,976 | $54,726 |
| 2020 | $2,123 | $61,651 | $6,925 | $54,726 |
| 2019 | $2,140 | $61,651 | $6,925 | $54,726 |
| 2018 | $2,158 | $61,651 | $6,925 | $54,726 |
| 2017 | $2,196 | $61,651 | $6,925 | $54,726 |
| 2016 | $2,138 | $61,651 | $6,925 | $54,726 |
| 2015 | $2,066 | $61,651 | $6,925 | $54,726 |
| 2014 | $2,109 | $61,926 | $7,200 | $54,726 |
Source: Public Records
Map
Nearby Homes
- 321 N East St
- 530 N East St
- 1848 W Marion Ave
- 5154 Grand Oak Cir
- 5905 de Osta Dr
- 739 Sandy Bottom Dr
- 744 Sandy Bottom Dr
- 751 Sandy Bottom Dr
- 433 Long Pond Rd
- 209 Island St
- 449 Long Pond Rd
- 801 Long Pond Rd
- 805 Long Pond Rd
- 6017 4h Club Rd
- 6021 4h Club Rd
- 5469 S Old Highway 41
- 6024 4-H Club Rd
- 1932 W Marion Ave
- 218 Baxley Dr
- 206 Harris Trail
- 502 N East St
- 0 N East St
- 621 N East St
- 305 N East St
- 306 N Main St
- 300 N East St
- 110 W Collins Ave
- 300 N Main St
- 307 N Main St
- 301 N Main St
- 5709 Georgia 376
- 213 N East St
- 200 N East St
- 211 N Main St
- 200 W Collins Ave
- 210 S West St
- 208 W Collins Ave
- 111 Oak St
- 211 S West St
- 35 E Marion Ave Unit Lot 35