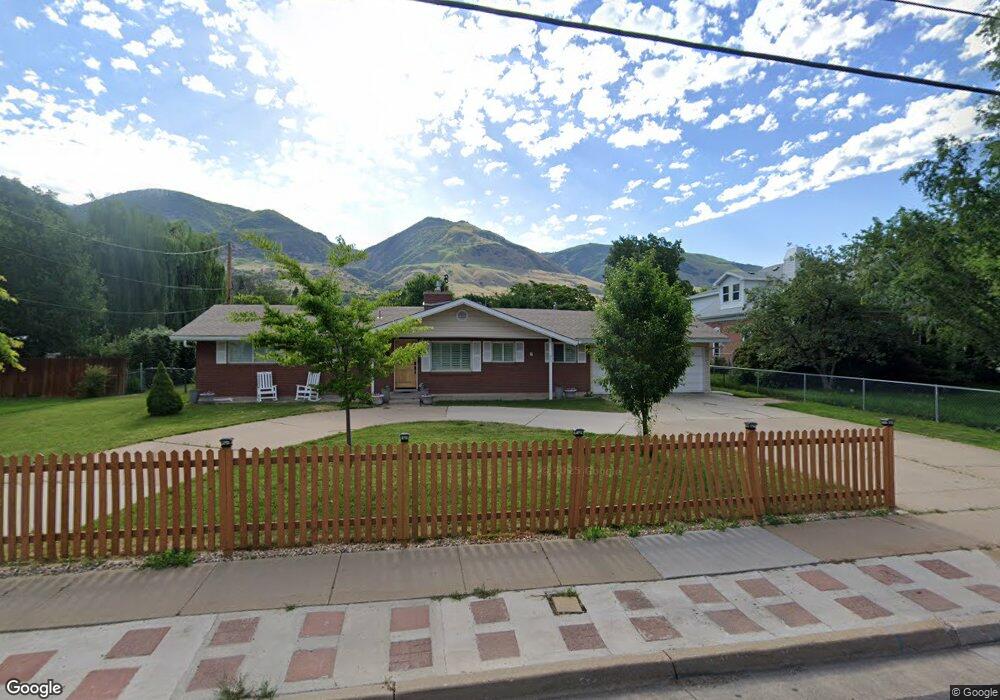
510 N Main St Centerville, UT 84014
Estimated Value: $536,000 - $681,000
3
Beds
3
Baths
2,422
Sq Ft
$249/Sq Ft
Est. Value
About This Home
This home is located at 510 N Main St, Centerville, UT 84014 and is currently estimated at $602,907, approximately $248 per square foot. 510 N Main St is a home located in Davis County with nearby schools including Centerville Elementary, Centerville Jr High, and Viewmont High School.
Ownership History
Date
Name
Owned For
Owner Type
Purchase Details
Closed on
Apr 2, 2019
Sold by
Smith Larry G and Smith Joan M
Bought by
Oveson Merrill L and Oveson Brenda A
Current Estimated Value
Home Financials for this Owner
Home Financials are based on the most recent Mortgage that was taken out on this home.
Original Mortgage
$206,300
Outstanding Balance
$132,844
Interest Rate
4.3%
Mortgage Type
New Conventional
Estimated Equity
$470,063
Purchase Details
Closed on
Jan 28, 2010
Sold by
Larson Gregory
Bought by
Smith Larry G and Smith Joan M
Create a Home Valuation Report for This Property
The Home Valuation Report is an in-depth analysis detailing your home's value as well as a comparison with similar homes in the area
Purchase History
| Date | Buyer | Sale Price | Title Company |
|---|---|---|---|
| Oveson Merrill L | -- | Us Title Company Of | |
| Smith Larry G | -- | Bonneville Superior Title |
Source: Public Records
Mortgage History
| Date | Status | Borrower | Loan Amount |
|---|---|---|---|
| Open | Oveson Merrill L | $206,300 |
Source: Public Records
Tax History
| Year | Tax Paid | Tax Assessment Tax Assessment Total Assessment is a certain percentage of the fair market value that is determined by local assessors to be the total taxable value of land and additions on the property. | Land | Improvement |
|---|---|---|---|---|
| 2025 | $3,019 | $288,750 | $186,199 | $102,551 |
| 2024 | $2,872 | $279,400 | $173,275 | $106,125 |
| 2023 | $2,651 | $466,000 | $276,439 | $189,561 |
| 2022 | $2,773 | $268,400 | $141,161 | $127,239 |
| 2021 | $2,480 | $374,000 | $224,431 | $149,569 |
| 2020 | $2,229 | $336,000 | $214,636 | $121,364 |
| 2019 | $2,309 | $340,000 | $200,423 | $139,577 |
| 2018 | $2,165 | $315,000 | $185,193 | $129,807 |
| 2016 | $228 | $150,810 | $70,703 | $80,107 |
| 2015 | $1,823 | $139,040 | $70,703 | $68,337 |
| 2014 | $137 | $134,971 | $70,703 | $64,268 |
| 2013 | -- | $130,104 | $45,189 | $84,915 |
Source: Public Records
Map
Nearby Homes
- 563 N 220 E
- 295 E 500 N
- 282 W 605 N Unit A
- 282 W 605 N Unit I
- 281 W 650 N Unit B
- 56 W 200 N
- 66 Brookside Ln
- 775 Pheasantbrook Cir
- 303 W 650 N Unit I
- 22 Creekside Ln
- 292 W 680 N
- 380 E 400 N
- 781 Pheasantbrook Dr
- 252 N 400 E
- 16 S 200 E
- 493 W 620 N Unit 122
- 507 W 620 N
- 147 N 360 W Unit 21
- 88 W 50 S Unit C-3
- 88 W 50 S Unit B5
Your Personal Tour Guide
Ask me questions while you tour the home.