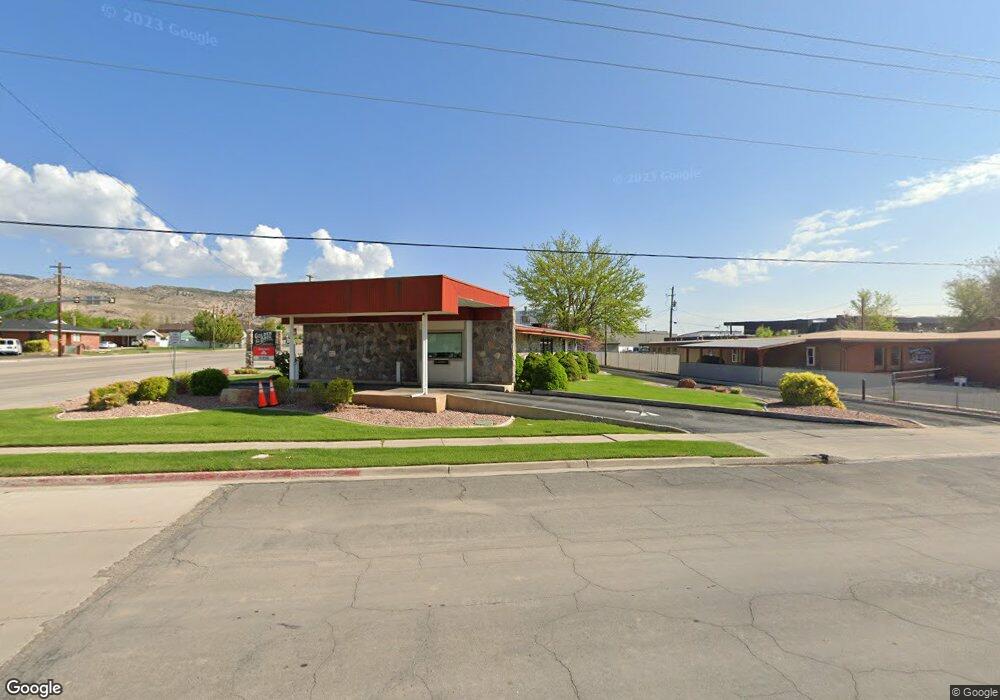
510 N Main St Richfield, UT 84701
Estimated Value: $355,000 - $551,000
--
Bed
--
Bath
1,952
Sq Ft
$221/Sq Ft
Est. Value
About This Home
This home is located at 510 N Main St, Richfield, UT 84701 and is currently estimated at $430,988, approximately $220 per square foot. 510 N Main St is a home with nearby schools including Pahvant School, Ashman School, and Red Hills Middle School.
Ownership History
Date
Name
Owned For
Owner Type
Purchase Details
Closed on
Aug 24, 2018
Sold by
Morwood Marsha
Bought by
Morwood Larry M
Current Estimated Value
Purchase Details
Closed on
Aug 23, 2018
Sold by
Morwood Larry M
Bought by
Morwood Larry M
Purchase Details
Closed on
Aug 19, 2010
Sold by
Morwood Larry and Morwood Marsha
Bought by
Morwood Larry and Morwood Marsha
Purchase Details
Closed on
Jul 25, 2005
Sold by
Bates Jeff and Bates Suzan
Bought by
Morwood Larry and Morwood Marsha
Create a Home Valuation Report for This Property
The Home Valuation Report is an in-depth analysis detailing your home's value as well as a comparison with similar homes in the area
Home Values in the Area
Average Home Value in this Area
Purchase History
| Date | Buyer | Sale Price | Title Company |
|---|---|---|---|
| Morwood Larry M | -- | D Land Title | |
| Morwood Larry M | -- | D Land Title | |
| Morwood Larry | -- | -- | |
| Morwood Larry | -- | D Land Title |
Source: Public Records
Tax History Compared to Growth
Tax History
| Year | Tax Paid | Tax Assessment Tax Assessment Total Assessment is a certain percentage of the fair market value that is determined by local assessors to be the total taxable value of land and additions on the property. | Land | Improvement |
|---|---|---|---|---|
| 2024 | $1,527 | $183,013 | $38,783 | $144,230 |
| 2023 | $1,561 | $210,379 | $36,981 | $173,398 |
| 2022 | $1,796 | $184,451 | $31,096 | $153,355 |
| 2021 | $1,540 | $132,621 | $29,991 | $102,630 |
| 2020 | $1,158 | $93,000 | $16,791 | $76,209 |
| 2019 | $988 | $84,570 | $16,800 | $67,770 |
| 2018 | $1,066 | $81,450 | $16,830 | $64,620 |
| 2017 | $1,026 | $74,740 | $14,050 | $60,690 |
| 2016 | $692 | $71,040 | $0 | $0 |
| 2015 | $692 | $64,280 | $0 | $0 |
| 2014 | $692 | $64,290 | $0 | $0 |
Source: Public Records
Map
Nearby Homes