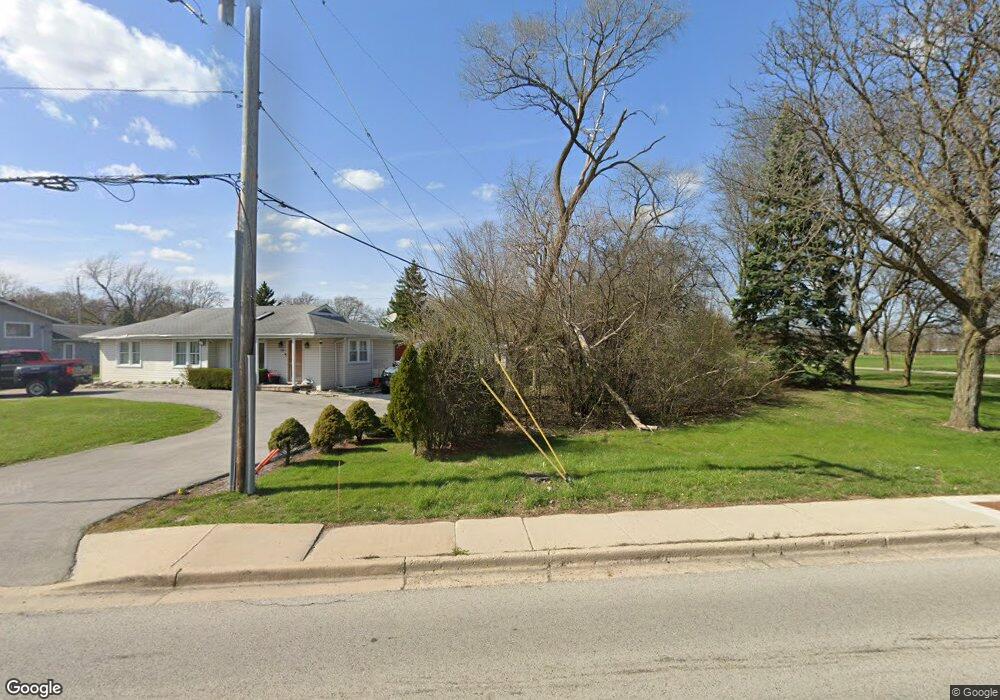
510 Plainfield Rd Darien, IL 60561
Estimated Value: $360,000 - $420,288
4
Beds
2
Baths
1,321
Sq Ft
$292/Sq Ft
Est. Value
About This Home
This home is located at 510 Plainfield Rd, Darien, IL 60561 and is currently estimated at $386,322, approximately $292 per square foot. 510 Plainfield Rd is a home located in DuPage County with nearby schools including Mark Delay School, Lace Elementary School, and Eisenhower Jr High School.
Ownership History
Date
Name
Owned For
Owner Type
Purchase Details
Closed on
Sep 22, 2022
Sold by
Chiong John B and Chiong Aloha M
Bought by
Aloha May A Chiong 2022 Living Trust and Chiong
Current Estimated Value
Purchase Details
Closed on
May 21, 2009
Sold by
Packeviciene Daiva
Bought by
Chiong John B and Chiong Aloha M
Home Financials for this Owner
Home Financials are based on the most recent Mortgage that was taken out on this home.
Original Mortgage
$202,268
Interest Rate
4.85%
Mortgage Type
FHA
Purchase Details
Closed on
Jul 11, 2002
Sold by
Bendig Shirley Jane and Bendig Ronald J
Bought by
Packeviciene Daiva
Home Financials for this Owner
Home Financials are based on the most recent Mortgage that was taken out on this home.
Original Mortgage
$184,300
Interest Rate
6.7%
Purchase Details
Closed on
Nov 21, 2001
Sold by
Bromark Company
Bought by
Bendig Shirley Jane and Bendig Ronald J
Purchase Details
Closed on
Nov 1, 2000
Sold by
King Gary A
Bought by
Bromark Company
Create a Home Valuation Report for This Property
The Home Valuation Report is an in-depth analysis detailing your home's value as well as a comparison with similar homes in the area
Home Values in the Area
Average Home Value in this Area
Purchase History
| Date | Buyer | Sale Price | Title Company |
|---|---|---|---|
| Aloha May A Chiong 2022 Living Trust | -- | None Listed On Document | |
| Chiong John B | $206,000 | First American Title Ins Co | |
| Packeviciene Daiva | $190,000 | Law Title | |
| Bendig Shirley Jane | $85,500 | -- | |
| Bromark Company | -- | -- |
Source: Public Records
Mortgage History
| Date | Status | Borrower | Loan Amount |
|---|---|---|---|
| Previous Owner | Chiong John B | $202,268 | |
| Previous Owner | Packeviciene Daiva | $184,300 |
Source: Public Records
Tax History Compared to Growth
Tax History
| Year | Tax Paid | Tax Assessment Tax Assessment Total Assessment is a certain percentage of the fair market value that is determined by local assessors to be the total taxable value of land and additions on the property. | Land | Improvement |
|---|---|---|---|---|
| 2024 | $5,934 | $100,480 | $62,396 | $38,084 |
| 2023 | $5,702 | $92,370 | $57,360 | $35,010 |
| 2022 | $5,181 | $83,390 | $54,570 | $28,820 |
| 2021 | $4,982 | $82,440 | $53,950 | $28,490 |
| 2020 | $4,913 | $80,810 | $52,880 | $27,930 |
| 2019 | $4,744 | $77,540 | $50,740 | $26,800 |
| 2018 | $4,152 | $69,120 | $50,540 | $18,580 |
| 2017 | $4,105 | $66,510 | $48,630 | $17,880 |
| 2016 | $3,991 | $63,470 | $46,410 | $17,060 |
| 2015 | $3,924 | $59,710 | $43,660 | $16,050 |
| 2014 | $4,308 | $64,130 | $47,170 | $16,960 |
| 2013 | $5,378 | $80,700 | $46,950 | $33,750 |
Source: Public Records
Map
Nearby Homes
- 7216 Leonard Dr
- 7510 Farmingdale Dr Unit 208
- 320 Sheridan Dr Unit 2C
- 7525 Nantucket Dr Unit 210
- 7515 Nantucket Dr Unit 404
- 7715 Sussex Creek Dr Unit 1D
- 7310 Capitol Dr
- 716 Somerset Ln
- 7817 Mayfair Ln
- 7831 Clarendon Hills Rd
- 1125 Timber Ln Unit 2
- 7718 Virginia Ct
- 7715 Virginia Ct
- 209 67th St
- 709 79th St Unit 103
- 709 79th St Unit 307
- 709 79th St Unit 403
- 7713 Brookhaven Ave
- 7235 Willow Way Ln Unit B
- 301 Lake Hinsdale Dr Unit 106
- 7305 Tennessee Ave
- 7301 Tennessee Ave
- 7215 Tennessee Ave
- 7306 Tennessee Ave
- 7302 Tennessee Ave
- 105 Scriven St
- 22 St Joseph Point
- 532 Plainfield Rd
- 533 73rd St
- 7214 Tennessee Ave
- 7209 Tennessee Ave
- 7210 Tennessee Ave
- 536 Plainfield Rd
- 537 73rd St
- 536 73rd St
- 7213 Bentley Ave
- 540 Plainfield Rd
- 7206 Tennessee Ave
- 7201 Tennessee Ave
- 7202 Tennessee Ave