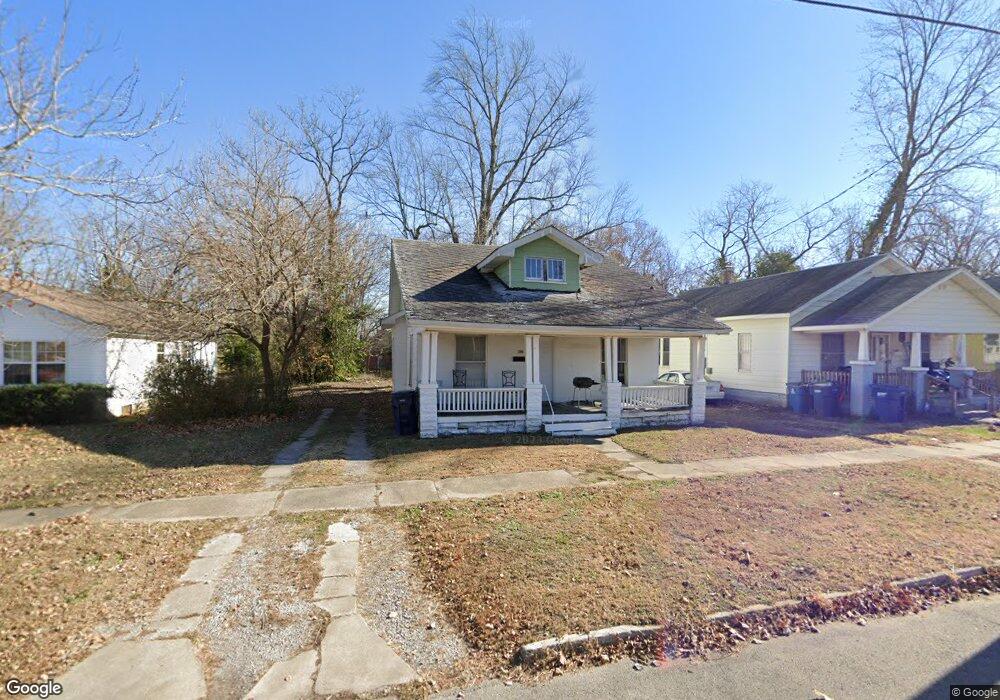
510 S 18th St Mount Vernon, IL 62864
Estimated Value: $43,000 - $62,216
2
Beds
1
Bath
988
Sq Ft
$51/Sq Ft
Est. Value
About This Home
This home is located at 510 S 18th St, Mount Vernon, IL 62864 and is currently estimated at $50,554, approximately $51 per square foot. 510 S 18th St is a home located in Jefferson County with nearby schools including Osborne Primary Center, J.L. Buford Intermediate Education Center, and Zadok Casey Middle School.
Ownership History
Date
Name
Owned For
Owner Type
Purchase Details
Closed on
May 3, 2021
Sold by
Jefferson County Of
Bought by
P & N Properties Inc
Current Estimated Value
Purchase Details
Closed on
Apr 30, 2021
Sold by
P & N Properties Inc
Bought by
Doggan Markesha
Purchase Details
Closed on
Aug 25, 2011
Sold by
Raider Group Llc
Bought by
Neal Michael A
Home Financials for this Owner
Home Financials are based on the most recent Mortgage that was taken out on this home.
Original Mortgage
$25,000
Interest Rate
4.58%
Mortgage Type
Purchase Money Mortgage
Create a Home Valuation Report for This Property
The Home Valuation Report is an in-depth analysis detailing your home's value as well as a comparison with similar homes in the area
Home Values in the Area
Average Home Value in this Area
Purchase History
| Date | Buyer | Sale Price | Title Company |
|---|---|---|---|
| P & N Properties Inc | -- | None Available | |
| Doggan Markesha | -- | None Available | |
| Neal Michael A | $15,000 | None Available |
Source: Public Records
Mortgage History
| Date | Status | Borrower | Loan Amount |
|---|---|---|---|
| Previous Owner | Neal Michael A | $25,000 |
Source: Public Records
Tax History Compared to Growth
Tax History
| Year | Tax Paid | Tax Assessment Tax Assessment Total Assessment is a certain percentage of the fair market value that is determined by local assessors to be the total taxable value of land and additions on the property. | Land | Improvement |
|---|---|---|---|---|
| 2024 | $428 | $9,622 | $3,363 | $6,259 |
| 2023 | $441 | $8,883 | $3,105 | $5,778 |
| 2022 | $476 | $7,792 | $2,724 | $5,068 |
| 2021 | $721 | $7,421 | $2,594 | $4,827 |
| 2020 | $723 | $6,935 | $2,424 | $4,511 |
| 2019 | $713 | $6,935 | $2,424 | $4,511 |
| 2018 | $705 | $6,935 | $2,424 | $4,511 |
| 2017 | $690 | $6,935 | $2,424 | $4,511 |
| 2016 | $908 | $9,349 | $2,424 | $6,925 |
| 2015 | $888 | $9,349 | $2,424 | $6,925 |
| 2014 | $855 | $9,349 | $2,424 | $6,925 |
| 2013 | $855 | $8,820 | $2,287 | $6,533 |
Source: Public Records
Map
Nearby Homes