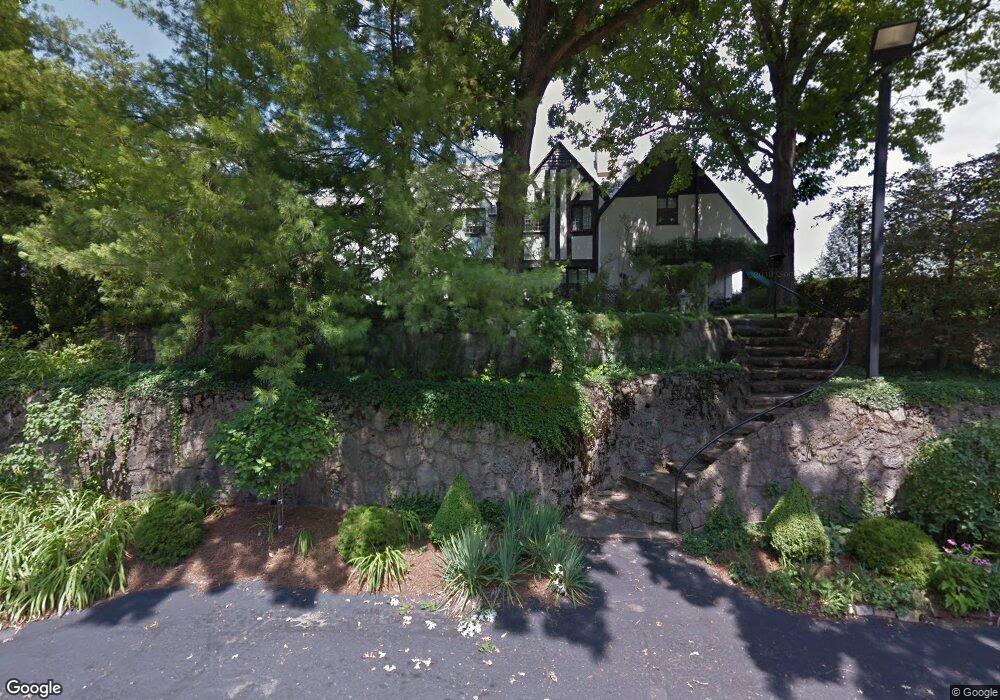
510 S D St Hamilton, OH 45013
Estimated Value: $629,958 - $779,000
4
Beds
3
Baths
4,331
Sq Ft
$161/Sq Ft
Est. Value
About This Home
This home is located at 510 S D St, Hamilton, OH 45013 and is currently estimated at $699,240, approximately $161 per square foot. 510 S D St is a home located in Butler County with nearby schools including Ridgeway Elementary School, Wilson Middle School, and Hamilton Freshman School.
Ownership History
Date
Name
Owned For
Owner Type
Purchase Details
Closed on
Feb 26, 2020
Sold by
Wehr Kenneth L
Bought by
Chou Michael and Chou Patricia Anne
Current Estimated Value
Home Financials for this Owner
Home Financials are based on the most recent Mortgage that was taken out on this home.
Original Mortgage
$427,500
Outstanding Balance
$378,612
Interest Rate
3.5%
Mortgage Type
New Conventional
Estimated Equity
$320,628
Purchase Details
Closed on
Sep 1, 1985
Create a Home Valuation Report for This Property
The Home Valuation Report is an in-depth analysis detailing your home's value as well as a comparison with similar homes in the area
Home Values in the Area
Average Home Value in this Area
Purchase History
| Date | Buyer | Sale Price | Title Company |
|---|---|---|---|
| Chou Michael | $450,000 | None Available | |
| -- | $190,000 | -- |
Source: Public Records
Mortgage History
| Date | Status | Borrower | Loan Amount |
|---|---|---|---|
| Open | Chou Michael | $427,500 |
Source: Public Records
Tax History Compared to Growth
Tax History
| Year | Tax Paid | Tax Assessment Tax Assessment Total Assessment is a certain percentage of the fair market value that is determined by local assessors to be the total taxable value of land and additions on the property. | Land | Improvement |
|---|---|---|---|---|
| 2024 | $8,880 | $210,440 | $25,230 | $185,210 |
| 2023 | $8,839 | $210,440 | $25,230 | $185,210 |
| 2022 | $7,910 | $158,280 | $25,230 | $133,050 |
| 2021 | $6,915 | $152,680 | $25,230 | $127,450 |
| 2020 | $6,790 | $152,680 | $25,230 | $127,450 |
| 2019 | $8,902 | $121,580 | $25,610 | $95,970 |
| 2018 | $5,245 | $121,580 | $25,610 | $95,970 |
| 2017 | $5,290 | $121,580 | $25,610 | $95,970 |
| 2016 | $5,506 | $120,680 | $25,610 | $95,070 |
| 2015 | $5,476 | $120,680 | $25,610 | $95,070 |
| 2014 | $5,513 | $120,680 | $25,610 | $95,070 |
| 2013 | $5,513 | $128,730 | $25,610 | $103,120 |
Source: Public Records
Map
Nearby Homes