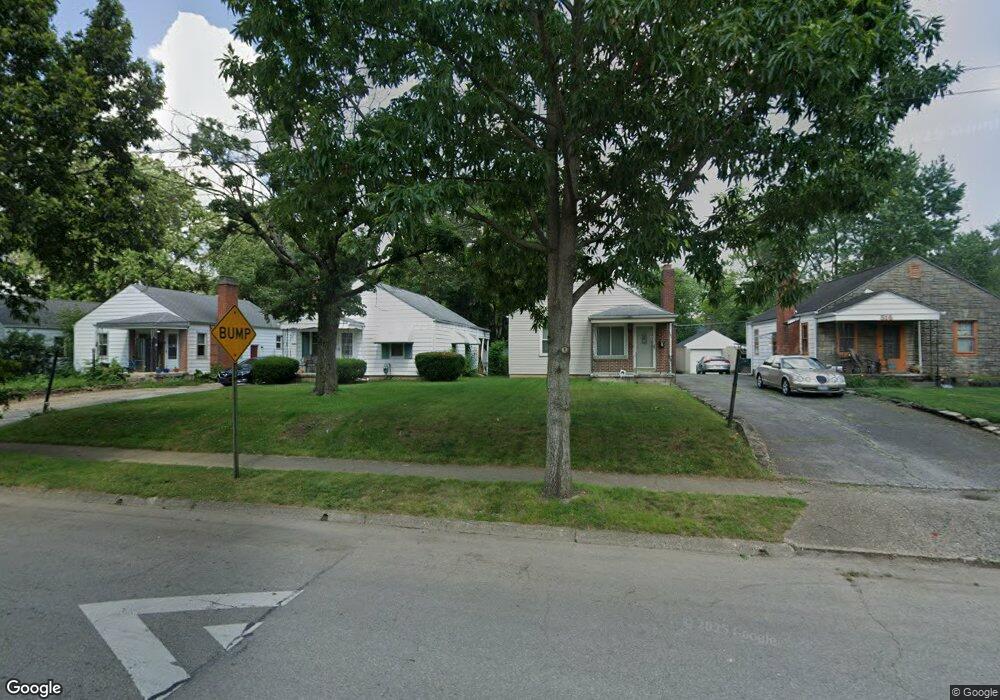
510 S Weyant Ave Columbus, OH 43213
Eastmoor NeighborhoodEstimated Value: $115,000 - $150,000
2
Beds
1
Bath
720
Sq Ft
$189/Sq Ft
Est. Value
About This Home
This home is located at 510 S Weyant Ave, Columbus, OH 43213 and is currently estimated at $135,891, approximately $188 per square foot. 510 S Weyant Ave is a home located in Franklin County with nearby schools including Fairmoor Elementary School, Johnson Park Middle School, and Walnut Ridge High School.
Ownership History
Date
Name
Owned For
Owner Type
Purchase Details
Closed on
Aug 18, 2006
Sold by
Furtron Industries Inc
Bought by
Cordle Jeffrey M
Current Estimated Value
Home Financials for this Owner
Home Financials are based on the most recent Mortgage that was taken out on this home.
Original Mortgage
$70,500
Outstanding Balance
$42,373
Interest Rate
6.78%
Mortgage Type
Purchase Money Mortgage
Estimated Equity
$93,518
Purchase Details
Closed on
Sep 12, 2005
Sold by
Schwalenberg Richard H and Manufacturers & Traders Trust
Bought by
Furtron Industries Inc
Purchase Details
Closed on
Apr 27, 1995
Sold by
Meshanko Robert P
Bought by
Richard H Schwalenberg
Home Financials for this Owner
Home Financials are based on the most recent Mortgage that was taken out on this home.
Original Mortgage
$49,500
Interest Rate
8.42%
Mortgage Type
New Conventional
Purchase Details
Closed on
Jan 1, 1984
Purchase Details
Closed on
Oct 1, 1983
Create a Home Valuation Report for This Property
The Home Valuation Report is an in-depth analysis detailing your home's value as well as a comparison with similar homes in the area
Home Values in the Area
Average Home Value in this Area
Purchase History
| Date | Buyer | Sale Price | Title Company |
|---|---|---|---|
| Cordle Jeffrey M | $70,500 | Prefered | |
| Furtron Industries Inc | $44,000 | -- | |
| Richard H Schwalenberg | $45,200 | -- | |
| -- | -- | -- | |
| -- | -- | -- |
Source: Public Records
Mortgage History
| Date | Status | Borrower | Loan Amount |
|---|---|---|---|
| Open | Cordle Jeffrey M | $70,500 | |
| Previous Owner | Richard H Schwalenberg | $49,500 |
Source: Public Records
Tax History Compared to Growth
Tax History
| Year | Tax Paid | Tax Assessment Tax Assessment Total Assessment is a certain percentage of the fair market value that is determined by local assessors to be the total taxable value of land and additions on the property. | Land | Improvement |
|---|---|---|---|---|
| 2024 | $1,763 | $39,280 | $11,660 | $27,620 |
| 2023 | $1,740 | $39,270 | $11,655 | $27,615 |
| 2022 | $1,451 | $27,970 | $5,080 | $22,890 |
| 2021 | $1,453 | $27,970 | $5,080 | $22,890 |
| 2020 | $1,455 | $27,970 | $5,080 | $22,890 |
| 2019 | $1,402 | $23,110 | $4,240 | $18,870 |
| 2018 | $1,286 | $23,110 | $4,240 | $18,870 |
| 2017 | $1,401 | $23,110 | $4,240 | $18,870 |
| 2016 | $1,292 | $19,500 | $3,780 | $15,720 |
| 2015 | $1,173 | $19,500 | $3,780 | $15,720 |
| 2014 | $1,175 | $19,500 | $3,780 | $15,720 |
| 2013 | $611 | $20,545 | $3,990 | $16,555 |
Source: Public Records
Map
Nearby Homes
- 647 S Napoleon Ave
- 646 S Weyant Ave
- 708 S Waverly St
- 733 S Napoleon Ave
- 635 Elizabeth Ave
- 711 S Waverly St
- 430 S James Rd
- 622 S Ashburton Rd
- 3160 Fair Ave
- 526 Collingwood Ave
- 836 S Weyant Ave
- 201 S Weyant Ave
- 277 S James Rd
- 565 S Kellner Rd
- 247 S James Rd
- 178 S Weyant Ave
- 842 S Hampton Rd
- 864 S Waverly St
- 892 Ruby Ave
- 804 S Ashburton Rd
- 506 S Weyant Ave
- 516 S Weyant Ave
- 500 S Weyant Ave
- 520 S Weyant Ave
- 494 S Weyant Ave
- 524 S Weyant Ave
- 517 S Napoleon Ave
- 511 S Napoleon Ave
- 490 S Weyant Ave
- 530 S Weyant Ave
- 507 S Napoleon Ave
- 527 S Napoleon Ave
- 509 S Napoleon Ave
- 501 S Napoleon Ave
- 533 S Napoleon Ave
- 499 S Weyant Ave
- 484 S Weyant Ave
- 536 S Weyant Ave
- 519 S Weyant Ave
- 497 S Napoleon Ave