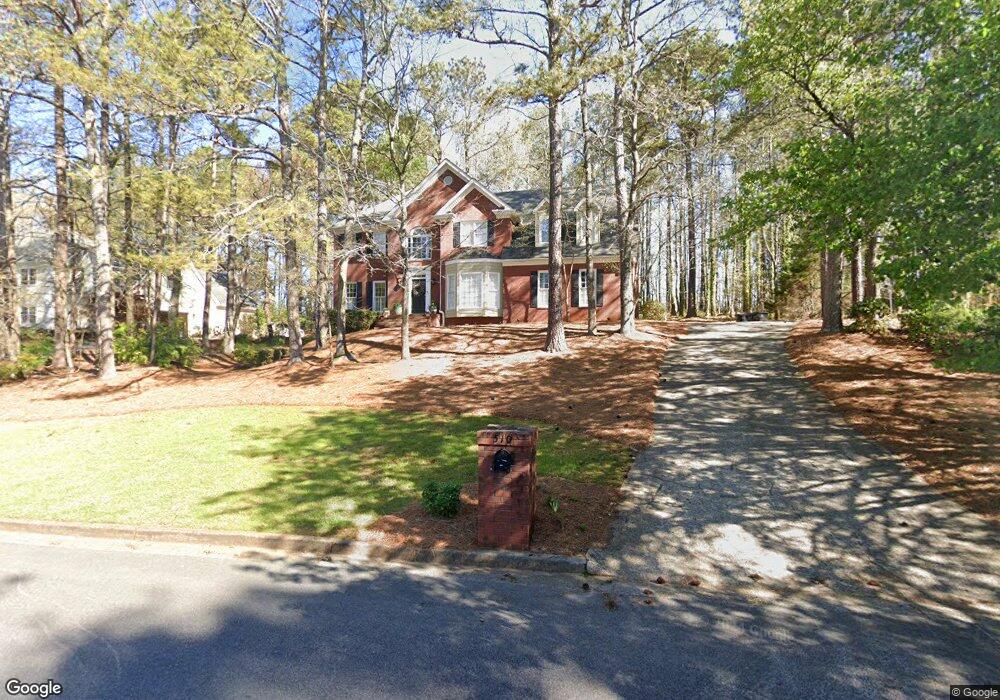
510 Saddlebrook Dr Unit 7 Roswell, GA 30075
Estimated Value: $759,000 - $812,000
6
Beds
4
Baths
3,275
Sq Ft
$242/Sq Ft
Est. Value
About This Home
This home is located at 510 Saddlebrook Dr Unit 7, Roswell, GA 30075 and is currently estimated at $792,093, approximately $241 per square foot. 510 Saddlebrook Dr Unit 7 is a home located in Fulton County with nearby schools including Sweet Apple Elementary School, Elkins Pointe Middle School, and Fulton Academy of Science and Technology.
Ownership History
Date
Name
Owned For
Owner Type
Purchase Details
Closed on
Dec 11, 2020
Sold by
Vaughn Donte Delano
Bought by
Vaughn Donte Delano and Degale Vaughn Hazel
Current Estimated Value
Home Financials for this Owner
Home Financials are based on the most recent Mortgage that was taken out on this home.
Original Mortgage
$479,750
Outstanding Balance
$427,882
Interest Rate
2.8%
Mortgage Type
New Conventional
Estimated Equity
$364,211
Purchase Details
Closed on
Mar 19, 2002
Sold by
Winter Carl
Bought by
Winter Sally
Purchase Details
Closed on
Apr 18, 1997
Sold by
Dunn John F and Dunn Sandra
Bought by
Winter Carl B and Winter Sally B
Home Financials for this Owner
Home Financials are based on the most recent Mortgage that was taken out on this home.
Original Mortgage
$214,600
Interest Rate
7.85%
Mortgage Type
New Conventional
Create a Home Valuation Report for This Property
The Home Valuation Report is an in-depth analysis detailing your home's value as well as a comparison with similar homes in the area
Home Values in the Area
Average Home Value in this Area
Purchase History
| Date | Buyer | Sale Price | Title Company |
|---|---|---|---|
| Vaughn Donte Delano | $505,000 | -- | |
| Vaughn Donte Delano | $505,000 | -- | |
| Winter Sally | -- | -- | |
| Winter Carl B | $283,000 | -- |
Source: Public Records
Mortgage History
| Date | Status | Borrower | Loan Amount |
|---|---|---|---|
| Open | Vaughn Donte Delano | $479,750 | |
| Closed | Vaughn Donte Delano | $479,750 | |
| Previous Owner | Winter Carl B | $214,600 |
Source: Public Records
Tax History Compared to Growth
Tax History
| Year | Tax Paid | Tax Assessment Tax Assessment Total Assessment is a certain percentage of the fair market value that is determined by local assessors to be the total taxable value of land and additions on the property. | Land | Improvement |
|---|---|---|---|---|
| 2025 | $1,237 | $312,520 | $76,880 | $235,640 |
| 2023 | $7,058 | $250,040 | $83,480 | $166,560 |
| 2022 | $6,570 | $249,720 | $37,200 | $212,520 |
| 2021 | $6,389 | $200,600 | $37,080 | $163,520 |
| 2020 | $5,640 | $209,960 | $37,080 | $172,880 |
| 2019 | $858 | $173,080 | $41,880 | $131,200 |
| 2018 | $4,633 | $182,560 | $24,520 | $158,040 |
| 2017 | $4,629 | $175,560 | $23,600 | $151,960 |
| 2016 | $4,607 | $175,560 | $23,600 | $151,960 |
| 2015 | $5,581 | $175,560 | $23,600 | $151,960 |
| 2014 | $3,806 | $136,920 | $36,800 | $100,120 |
Source: Public Records
Map
Nearby Homes
- 600 Rounsaville Rd
- 11625 Northgate Way
- 2230 Ashton Dr
- 1115 Primrose Dr
- 4404 Orchard Trace
- 11850 Chaffin Rd
- 530 Camber Woods Dr
- 565 Camber Woods Dr
- 345 Chaffin Ridge Ct
- 406 Sweet Apple Cir
- 640 Mae Ln
- 290 Rucker Rd
- 220 Hollyberry Dr
- 220 Hollyberry Ct
- 1040 Jordan Ln
- 285 N Farm Dr
- 300 Saddle Creek Ln
- 125 Fortuna Ct
- 105 Kensington Pond Ct
- 510 Saddlebrook Dr
- 520 Saddlebrook Dr
- 500 Saddlebrook Dr Unit 2
- 490 Saddlebrook Dr
- 530 Saddlebrook Dr
- 530 Saddlebrook Dr Unit 2
- 475 Saddlebrook Dr
- 485 Saddlebrook Dr Unit 2
- 465 Saddlebrook Dr
- 495 Saddlebrook Dr
- 480 Saddlebrook Dr
- 455 Saddlebrook Dr
- 505 Saddlebrook Dr
- 470 Saddlebrook Dr Unit 2
- 515 Saddlebrook Dr
- 445 Saddlebrook Dr
- 525 Saddlebrook Dr Unit 2
- 11790 Crabapple Rd
- 435 Saddlebrook Dr
- 730 Saddlebrook Close