510 Upper Green Glade Rd Swanton, MD 21561
Estimated Value: $198,202 - $317,000
--
Bed
--
Bath
1,040
Sq Ft
$261/Sq Ft
Est. Value
About This Home
This home is located at 510 Upper Green Glade Rd, Swanton, MD 21561 and is currently estimated at $271,734, approximately $261 per square foot. 510 Upper Green Glade Rd is a home located in Garrett County with nearby schools including Broad Ford Elementary School, Southern Middle School, and Southern Garrett High School.
Ownership History
Date
Name
Owned For
Owner Type
Purchase Details
Closed on
Jan 22, 2007
Sold by
Lambert Vincent P
Bought by
Lambert Vincent P and Lambert Coreen D
Current Estimated Value
Home Financials for this Owner
Home Financials are based on the most recent Mortgage that was taken out on this home.
Original Mortgage
$103,500
Outstanding Balance
$62,126
Interest Rate
6.29%
Mortgage Type
Stand Alone Refi Refinance Of Original Loan
Estimated Equity
$209,608
Purchase Details
Closed on
Dec 18, 2006
Sold by
Lambert Vincent P
Bought by
Lambert Vincent P and Lambert Coreen D
Home Financials for this Owner
Home Financials are based on the most recent Mortgage that was taken out on this home.
Original Mortgage
$103,500
Outstanding Balance
$62,126
Interest Rate
6.29%
Mortgage Type
Stand Alone Refi Refinance Of Original Loan
Estimated Equity
$209,608
Purchase Details
Closed on
Jan 29, 2001
Sold by
Lambert Vincent P and Lambert Sharon L
Bought by
Lambert Vincent P
Create a Home Valuation Report for This Property
The Home Valuation Report is an in-depth analysis detailing your home's value as well as a comparison with similar homes in the area
Home Values in the Area
Average Home Value in this Area
Purchase History
| Date | Buyer | Sale Price | Title Company |
|---|---|---|---|
| Lambert Vincent P | -- | -- | |
| Lambert Vincent P | -- | -- | |
| Lambert Vincent P | -- | -- |
Source: Public Records
Mortgage History
| Date | Status | Borrower | Loan Amount |
|---|---|---|---|
| Open | Lambert Vincent P | $103,500 | |
| Closed | Lambert Vincent P | $103,500 |
Source: Public Records
Tax History Compared to Growth
Tax History
| Year | Tax Paid | Tax Assessment Tax Assessment Total Assessment is a certain percentage of the fair market value that is determined by local assessors to be the total taxable value of land and additions on the property. | Land | Improvement |
|---|---|---|---|---|
| 2025 | $1,464 | $126,667 | $0 | $0 |
| 2024 | $1,350 | $113,000 | $30,000 | $83,000 |
| 2023 | $1,310 | $109,600 | $0 | $0 |
| 2022 | $1,240 | $106,200 | $0 | $0 |
| 2021 | $1,184 | $102,800 | $30,000 | $72,800 |
| 2020 | $1,184 | $101,333 | $0 | $0 |
| 2019 | $1,196 | $99,867 | $0 | $0 |
| 2018 | $1,114 | $98,400 | $30,000 | $68,400 |
| 2017 | $1,084 | $98,400 | $0 | $0 |
| 2016 | -- | $98,400 | $0 | $0 |
| 2015 | -- | $98,500 | $0 | $0 |
| 2014 | -- | $98,500 | $0 | $0 |
Source: Public Records
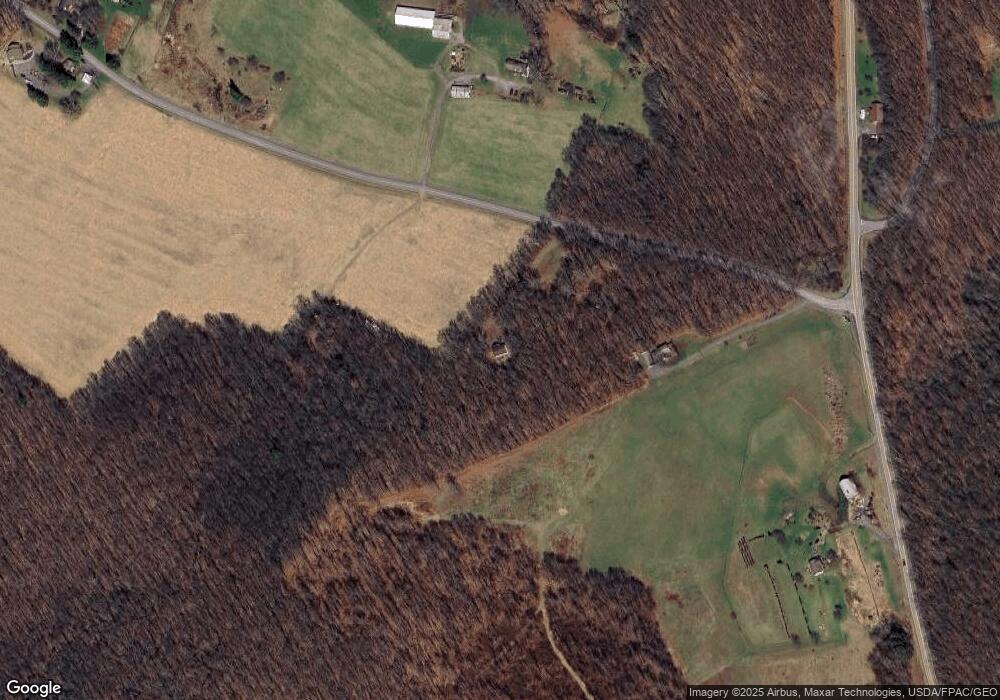
Map
Nearby Homes
- TBD Upper Green Glade Rd
- 2043 Green Glade Rd
- 468 Pritts Rd
- 0 Hazelhurst Rd Unit C MDGA2009820
- 0 Hazelhurst Rd Unit B MDGA2009814
- 807 Green Glade Rd
- 907 Hazelhurst Rd Unit A
- 249 Hazelhurst Rd
- 0 Crows Point Rd
- 3601 Swanton Rd
- 0 Sears Ln Unit MDGA2009994
- 167 Sears Ln
- 95 Frederick Cir
- 0 Green Glade Rd Unit MDGA2010316
- LOT 3 Poland Vista Ln N
- Lot 5 Azalea Ln
- 38 Hidden Valley Ln
- 11 Thousand Acres Rd
- 4 Thousand Acres Poland Run Rd E
- 189 Deer Run Ln
- 556 Upper Green Glade Rd
- 510 Green Glade Rd
- 451 Upper Green Glade Rd
- 678 Upper Green Glade Rd
- 2 Spring Creek Ln
- 3 Spring Lick Rd
- 12 Spring Lick Rd
- 1010 Bittinger Rd
- 75 Spring Lick Rd
- 763 Bittinger Rd
- 234 Upper Green Glade Rd
- 1181 Bittinger Rd
- 217 Upper Green Glade Rd
- 96 Spring Lick Rd
- 230 Upper Green Glade Rd
- 1241 Bittinger Rd
- 168 Upper Green Glade Rd
- 110 Upper Green Glade Rd
- 1325 Bittinger Rd
- 608 Bittinger Rd